The Altman Z-Score ("Z-Score") is a formula developed by Dr. Richard Altman that gauges a publicly-traded manufacturer's likelihood of bankruptcy. It was initially created in 1968 and proved useful, particularly regarding predicting bankruptcy two years out (72% accuracy rate with a 6% false-positive rate, under specific conditions).

Given the impact of COVID and global economic declines experiences in 2020, we felt it was time to review the Z-Scores for our Manufacturing Index. The Score uses five financial ratios to predict a company’s likelihood of going bankrupt. The ratios measure Profitability, Leverage, Liquidity, Solvency, and Activity.

Liquidity is measured by dividing working capital by total assets (WC/TA) and determining its ability to cover short-term liabilities by comparing its working capital assets to its total asset base. A higher ratio indicates that a more significant portion of the company's assets are current and could be turned into near-term cash to cover liabilities and operating shortfalls.
Leverage measures the amount of retained earnings used to purchase company assets (RE/TA) and shows how reliant a company is on debt to finance its asset base. A company that pays out most of its net income in the form of dividends (or one with negative cumulative net income) would see a much lower ratio than one who uses its earnings to invest in its asset base. A lower ratio means that a more significant portion of the company's assets are financed by debt, increasing bankruptcy risk.
Profitability is measured by a company's EBIT/TA, similar to the return on assets formula. This measure removes the impact of tax and interest from the equation and focuses on operating income instead. The greater a company's ability to generate operating income from its assets reduces the likelihood of bankruptcy.
Solvency shows "how much the firm's assets can decline in value (measured by market capitalization) before the liabilities exceed the asset base and the firm becomes insolvent." While it is true that a high market capitalization can assist a company in reducing its liabilities through additional equity raises, market capitalization can rapidly decline if a company enters financial distress.
Activity measures the company's ability to generate sales from its asset base (Sales/TA).
[Z-Score = 1.2(Liquidity)+1.4(Leverage)+3.3(Profitability)+0.6(Solvency)+(Activity)]
(GRAPHIC: What does the Score Mean? High Probability of Bankruptcy <1.8; 1.8>grey zone<3.0; Safe Zone>3.0.
Companies with a score of less than 1.8 indicate a high likelihood of bankruptcy, while a score greater than 3.0 indicates a company in a safe zone with a low probability. Companies in the middle are in the grey zone.)
Our manufacturing Index has 59 companies active. Of those, only 18 are in the 'Safe Zone', two of which we discuss below. There are 17 companies in the Grey Zone, with the balance (24) in the danger or high probability zone. We discuss two of those companies as well.
Some observations:
Younger or newer firms typically will have lower (or negative) retained earnings, which drags their Z-Scores down. Dividend-paying firms may also have lower retained earnings and lower Leverage scores as a result.
In almost all sectors, Solvency is the largest contributor to Z-Score and has the most significant volatility. Investor sentiment heavily impacts the Solvency score – how investors view the business, sector, and even how many investors follow the company.
Several companies may become reliant on their ability to raise capital through the equity markets and investor sentiment vs. strong financial performance – See Ballard below.
There is a disconnect between some companies Z-Scores and expected share performance this year, which we will further explore.
Twenty-four members of our Index have a negative Leverage score, indicating they have negative retained earnings and may be overly reliant on debt to fund asset purchases.
Z-Scores and Solvency Impact:
Since the Solvency score relies on market capitalizations, extreme changes in share prices can significantly alter a company's outlook. We see this in the extreme when we look at the top Z-Scores in our Index – and just how significant the impact market capitalization has.

In our Index, half of the top 10 Z-Scores are overly reliant on the Solvency score. Four of those would have negative scores if we excluded the Solvency score, meaning its operational and financial performance would be well into the danger zone. All but one has had significant share appreciation (Questor has seen a substantial drop in share value). GPV and BLDP, in particular, seem to be riding a big wave of positive investor sentiment, with BLDP recently completing an equity financing as well. The equity round by BLDP highlights one of the benefits of a strong Solvency score: raising capital in the equity markets. However, the Solvency score can turn quickly, eliminating that ability.
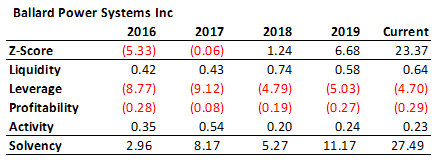
Ballard Power: Investor sentiment driving high Z-Score, leads to equity raise.
While market sentiment is an essential factor in gauging a company's viability and bankruptcy risk, financial performance must ultimately appear before that market sentiment changes. BLDP is currently riding a strong wave of battery, and green, investor sentiment. Its long history of operating losses, leading to significant negative retained earnings, is not a drastic event in and of itself. However, of more substantial concern to our eyes is its material underperformance concerning sales vs. total assets. At an Activity score of 0.23, it is by far the worst performer in our Index, and well below average, and may present a greater risk to Ballard long-term – an apparent inability to generate significant sales from its asset base. Diving even more in-depth, the Liquidity, Profitability, and Activity ratios over time do not demonstrate a substantial reversal in financial performance. With over $268 million in net working capital at the end of Q2, 2020, and its recent ATM equity raise of $250 million, BLDP does represent a low risk of bankruptcy as it has significant balance sheet strength. The company has a large runway to improve financial performance and demonstrates the benefit of a high Solvency score, raising additional capital.

Tree Island: low investor sentiment, declining Activity scores punctuate weakening Z-Score.
Tree Island, a small-cap manufacturer of wire products, shows the challenges of the Z-Score from the opposite perspective of Ballard. Like Ballard, Tree Island has a negative Leverage Z-Score but has a much lower Solvency score due to a low share price and low market capitalization. TSL, unlike Ballard, does have above-average Liquidity, Profitability, and Activity scores. Tree Island's Leverage score is also negatively impacted by its dividend payout, which reduces the amount of retained earnings available to fund assets. Also, concerns and trends to keep an eye on are the declining Activity scores and declining liquidity.

Shawcor Ltd.: Investor sentiment lowest in Index, covenant renegotiation required to avoid the Z-Score predicted fate.
For those of you familiar with Shawcor specifically or the energy sector in general, you are aware of some of the financial challenges faced by companies active in the industry. Shawcor is no exception. While the Shawcor emerged in 2017 in a "safe zone," according to the Z-Score, warning signs quickly appear. In 2018 we saw a substantial drop in Z-score, partially contributed by a decline in profitability, and a reversal in investor sentiment and declining market capitalizations. As sector and company performance declined in 2018 through the current period, investor sentiment rapidly eroded and compounded the effects on the Z-Score. COVID has undoubtedly assisted in the declines, but the signs were already there. Also, we want to highlight Shawcor as an example of the risks associated with Z-Scores with heavy reliance or contribution from the Solvency component. While Shawcor was not the most reliant historically, it shows how quickly investor sentiment and market forces can turn on a company, making access to capital very challenging, especially when needed.
Shawcor ceased paying its dividend in March of 2020 and renegotiated its credit facility's terms in July 2020, with covenant relief through December 31, 2021. This relief will help the company attempt to stave off bankruptcy as it works through its financial challenges. The Z-Score predicted Shawcor was trending downwards and in trouble at the end of 2019.

Hammond Power Solutions Inc.: Strong component scores not supporting higher investor sentiment
Our final component review is HPSa.TO, another small-cap business with above-average performance across the board… except its Solvency score, which is well below average, ranking in the 43rd percentile. Hammond is in the top quartile for all Z-Scores in its Leverage, Profitability, and Activity scores, making it one of the few companies reliant on a strong Solvency score to fuel its 'safe' Z-Score rating. Of our entire Index, only 18 companies are in the "Safe Zone," including Hammond. Of those, Hammond's Solvency score contributes 16% to its overall Z-Score, by far the lowest contribution by these Safe Zone companies. The next closest – Circa Enterprises –has a Solvency score contribution of over 26%. Hammond is the least reliant on positive investor sentiment or market capitalization drivers and more reliant on its financial operations and performance of the Safe Zone companies.
Conclusions: Z-Score is useful, but like all financial ratios, doesn't tell the whole story
The Z-Score is just one tool to assess publicly traded companies and their associated risks. By looking at the individual components that make up the Score, we can narrow our focus and learn what factors may be driving both company and market performance. We highlighted four companies from our Index above, including Ballard with the highest scores, Tree Island with one of the lowest, Shawcor as one of the more distressed in the Index, and Hammond Power, a potentially overlooked investment opportunity

The opposite holds for Shawcor as the capital markets are not overly optimistic about the energy sector or Shawcor's outlook. Shawcor has a dismal Solvency score, indicating its challenge in securing additional capital to reduce debt exposure.
Where we see exciting opportunities are in Hammond and Tree Island for similar reasons. Both are small-cap firms, and top tier performances in Activity – showing an ability to generate sales from their assets. Both are top half in Liquidity scores, indicating an ability to cover near-term obligations, and both are bottom half in Solvency scores. A low Solvency score can indicate extreme investor concern (like Shawcor) or indicate investors overlook these firms due to their small-cap nature. Tree Island, with its low Leverage score and bottom half Profitability score, carries significantly more risk than Hammond and its more substantial scores across the board. Ultimately we see a disconnect between Hammond and Ballard's respective share performance and its Z-Score component make-up. When we dive into forecasted earnings, the market's expectations for Ballard are somewhat lackluster, with no expectation for positive operating profit in the next three years. Ballard is riding a strong market wave of interest in improved battery power and green investment/sentiment, yet actual performance continues to elude it.
Hammond, like many small-caps, has no forecast estimates. However, it may be an overlooked opportunity given it is one of only four companies in the Safe Zone that performs in the top half of all financial Z-Score components (the others being BOS.TO, XTC.TO, and PFB.TO). It is also the only company in the Safe Zone below average in its Solvency score, meaning its market capitalization underperforms our Index. For interest sake, Hammond's share price is down 22% this year, and 27% below its 52-week high.