4 Key Trends for the Manufacturing Industry in 2021

As we welcome a new year, we look at several key trends that are happening in the manufacturing sector. These trends can help companies stay ahead of the curve. The year 2021 has much in store for the manufacturing industry, including four key trends: IoT & AIoT, employee safety, sustainability and 3D printing.

1.      IoT & AIoT

IoT & AIoT has been on the rise in the manufacturing industry in recent years and it will continue to be an important aspect in 2021. If you want to learn more about IoT and AIoT, click here. AIoT can include big data, predicative maintenance, industry 4.0 and more. An example of a company inviting in technology and IoT is Siemens. Over the past 10 years, Siemens has spent more than $10 billion acquiring software companies and currently employs more than 24,500 software engineers.

The following Canadian companies are leaders in the IoT sector and can help bring IoT and AIoT to your company.


Company                                        

Services

Website

Image
Using its AI-CORE™ robotic process automation (RPA) configurable software bots, CoreData can quickly and cost-effectively automate many business and operational processes. https://www.coredata.ca/


Image
Utilizing its extensive technical experience in real-time monitoring and control systems for Process Control, Power Utilities, Renewable Energy and Industrial IoT, MR Control Systems have developed a new generation of real-time monitoring and control platform. http://mrcsi.com/

Image
TEKTELIC Communications is a recognized supplier of best-in-class LoRaWAN™and NB-IoT Gateways, Sensors and Custom Applications. https://tektelic.com/
DYK1.PNG

A.      Big data

Big data is a key aspect of IoT and AIoT in the manufacturing industry. A business capturing big data is able to collect more information than ever before by turning almost any surface into a sensor for data collection. With a greater collection of data, businesses can make more informed decisions to improve efficiency, accuracy and ultimately profitability.

B.      Predictive Maintenance

According to ITIC (Information Technology Intelligence Consulting) 98 per cent of manufacturing companies have reported that a single hour of downtime can cost them over $100,000 in lost revenue. Manufacturing companies can use AIoT to leverage real-time operating data to drive improved maintenance planning and execution to increase up time and utilization of assets. Another advantage to predictive maintenance is the ability to schedule maintenance during slower production periods based on the data collected on production trends.

C.       Industry 4.0

Industry 4.0 is the enhancement of automation and data exchange technologies in the manufacturing process. This can include adoption of current AI and IoT technology throughout the operations, inside the machinery, in the warehouse and on the workers so that every aspect of an operation can collect data and “talk” to each other. Industry 4.0 can help reduce labour shortages and increase overall efficiency.

Learn more about Industry 4.0 here.

DYK2.PNG

2.      Employee safety

Employee safety has always been the top priority for the manufacturing industry, but since the COVID-19 pandemic, safety has become even more critical. 2021 will bring a stronger focus on employee safety and tracking. Many companies may introduce smart protective gear so data from the employees can be collected to help monitor their health and safety.

The sector will be spending more on personal protective equipment (PPE) and sanitization in 2021. In addition to controlling COVID-19, these measures should help increase productivity and employee morale as well as prevent employees from becoming ill and being distracted or worried about their working conditions. 

3.       Sustainability

74-1.jpg

For 2021 we believe sustainable manufacturing will continue to be a key trend. There are many benefits to become more sustainable, including reduced costs, increased profit margins and the potential to attract new customers. For more information on the benefits of sustainable manufacturing, click here.

Sustainability for manufacturing also includes localized production and sourcing. Consumers are making it clear that authenticity matters and that they value local products more. Localized production and sourcing also have its benefits such as no tariffs or trade disputes, faster time to market and lower working capital.

Ballard Power Systems Canada is a great example of a manufacturing company being sustainable. Burnaby based Ballard is a developer and manufacturer of proton exchange membrane fuel cell products for markets such as heavy-duty automotive, portable power, material handling. as well as engineering services. It has manufacturing facilities in Canada and its vision is to help Canada reach a place where there are zero emission fuel cell vehicles. Ballard is dedicated to both improving the environment and localized production.

4.      3D Printing

3D printing has been on the rise for a while. We believe it will continue to be a trend for manufacturing in 2021. In addition to increased affordability, 3D printing is being used to create critical parts, molds, jigs and fixtures for the manufacturing process. In most cases, the custom part can be produced in-house within hours instead of contracted externally with delivery in months. 3D printing also allows companies to make cost effective prototypes that allow product designers to test and troubleshoot new products in a matter of days with significantly reduced waste and lost time.

DYK3.PNG

Conclusion

We believe these four will be the most prominent for many different reasons, including: IoT & AIoT can help companies collect more data leading to better decision making to help save money and increase production. Employee safety will continue to be a priority for companies to keep employees healthy and have higher morale. Sustainability can help reduce costs and make a company more appealing to consumers. Lastly, 3D printing will continue to change the manufacturing industry with the number of different items it can produce in a cost-efficient manner within a short time frame.

Spin Master

Given all the downs of the year, we decided to profile a Canadian business success story that has nothing to do with vaccines, hand sanitizer or on-line conference call apps. This business has persevered through adversity, much success, missed opportunity, growing pains and global expansion to establish itself within an industry that is well over 100 years old and typically not too welcoming to new entrants.  As the holiday season is upon us, this profile seemed even more fitting as most of us will see this company’s products under our trees or with the children in our lives more than once over the holidays.   

You have likely heard of Air Hogs, PAW Patrol, Bakugan and Hatchimals. If not, consult anyone under 15 in your community. These are all products of Canadian toy company Spin Master Corp (TSX:TOY). Spin Master developed all these toys and the related television shows and movies that go along with them. Spin Master is a Canadian public company, having issued its subordinate voting shares on the TSX back in 2015. 

Best Known for the Following Toys / Brands:

1.PNG

Spin Master History

Started in 1994 in Toronto by childhood friends, Spin Master has grown to be a worldwide company that is publicly listed and distributes toys in more than 100 markets. The Company has won countless awards over the years (too many to list).

The Company’s 2016 prospectus suggests Spin Master’s history can be broken down into five key phases: (1) Start-Up Growth; (2) Building the Base; (3) Bakugan Growth; (4) Restructuring and Refocusing; and (5) Diversified Growth.

Start-Up Growth (1994-2001)

They get their start with Earth Buddy, a simple toy resembling a chia-pet. Which they followed up with Devil Sticks – a three stick juggling like game.

In 1996, two British inventors present an innovative toy airplane to the Company’s founders and the Air Hogs brand is launched with the first product the “Air Shark”. Its success is attributed to its affordability, its technological innovation and its ease of use.

Spin Master’s team develops a reputation of building sincere relationships and true collaboration with its partners, including inventors, designers, manufacturers, distributors and sales partners. 

In 2001, Spin Master exceeded $80 million in Gross Product Sales and the Company established a foundation for future growth.

Sourced from Spin Master

Sourced from Spin Master

Building the Base (2002-2007)

The business continued to introduce new innovative products, including Catch-a-Bubble, Aqua Doodle & Moon Sand as it expanded internationally. The Air Hog’s brand matured and filled out its portfolio with helicopters, wall climbing cars and even a flying saucer. As well, the Company got its start with entertainment franchises, when it was awarded the master toy license for The Wiggles. 

Acquisitions


In 2007, Spin Master’s Gross Product Sales were approximately $485 million

Bakugan Growth (2008-2010)

Spin Master launched Bakugan in late 2007.  The product was a collaboration with Sega Toys but initiated by Spin Master.  Bakugan is a card game that involves small toy balls that activate to become characters for the game.  An animated television show was also developed to support the game and toy sales. At its peak, in 2009, Bakugan recorded $387 million in sales. 

In 2010, Spin Master’s Gross Product Sales exceeded $900 million.

Gross Product.PNG

Restructuring and Refocusing (2011-2012)

The surge in sales of Bakugan and related products left the Company scrambling to manage the sharp growth of Bakugan and the natural decline that followed. When sales levels dropped, the cost structure of the company was out of line and a operational restructuring was needed to right size the business.  Management took the opportunity to recruit expertise, establish business policies and processes to increase accountability in order to better manage the business and achieve sustainable growth. Through the restructuring an emphasis was placed on involving entertainment content and technology with its products, which included animation, robots and other high-tech toys. 

Acquisitions


In 2012, Spin Master generated approximately $481 million in Gross Product Sales.

Diversified Growth (2013-Present)

Spin Master resumed its business growth in this phase with a renewed focus on diversification and financial discipline. The business was broadened organically and through acquisitions. The acquisitions of EtchASketch and Meccano and the launch of Zoomer, a robotic dinosaur, were key additions for the Company. The entertainment production division found its stride with the launch of Paw Patrol and Charmers. 

Acquisitions

2.PNG

In 2019, Spin Master generated approximately $1.7 billion in Gross Product Sales retaining its position as the 5th largest toy company in the US market and in the top 10 globally. 

While 2020 was expected to be a down year for Spin Master and the global toy industry, the impacts of the pandemic driven “lock-downs” on society has increased demand for puzzles, board games and toys dramatically.  Many manufacturers are struggling to keep up and Spin Master has seen its November sales increase 250% over last year.  December, the typical biggest month for retail sales, is expected to be up even more!

For more on Spin Mater’s history check out Spin Masters 20th anniversary YouTube video - https://www.youtube.com/watch?v=ysOZvW_LuDw

Stock Performance

share.PNG

Other than a short decline just after its IPO, Spin Master (TOY:TSE) had a growth rate of 52.5% annually from 2015 until March 2018. It was then that Toys-R-Us entered bankruptcy protection and Spin Master’s revenue growth disappeared. Its pace of new toy launches and innovation was too much to maintain in the long term. The stock then delivered a slow decline of 46.0% from its March 2018 high until its pre-pandemic price of $29.31 on March 4, 2020.

The early days of the pandemic was not kind to TOY:TSE, as its share price lost 2/3rds of its value – touching $10 per share on March 18, 2020. Q1-2020 was its first recorded operating income loss since its IPO. However, since then, Spin Master has recovered back to where it was just before the pandemic and appears to have matured into a stable, cash flow generating company – pandemic disruption aside.

DYK.PNG

What Is Next for Spin Master?

The business model has transformed over the past 15 years from mind blowing growth fueled by innovation, risk taking and pushing the limits of the entire industry into a M&A company that funds its buys with the cash flow and the balance sheet of the legacy business. The latter being much less exciting for shareholders than the uber-growth model but so is the life of a mature toy company. There is nothing wrong with being a billion-dollar revenue company that spits out cash and who knows perhaps there is a new toy innovation or industry busting idea just around the corner for Spin Master!   

Spin Master is a true Canadian success story that has benefitted from the entrepreneurial spirit of its founders, shrewd management, hard work, great fortune as well as innovation and a freedom to push the boundaries of an often stoic industry to find a seat as a global leader in the sector. With the recent announcement of the senior management succession from co-founders Ronnen Harary and Anton Rabie to a new former SC Johnson executive, Max Rangel, the business is starting afresh with new challenges and new opportunities, no doubt. 

Food Hydrocolloids

Food hydrocolloids have been gaining popularity over the past decade, they help food in many ways including structure and texture. This article looks at what hydrocolloids are, what they are made from, who makes them and what they are used in. This article also looks at the market trend of food hydrocolloids and how its market share is expected to be USD 9.12 billion by 2024.

What are Food Hydrocolloids?

Food hydrocolloids are a food ingredient that are often used in the structure of food that help contribute to the viscosity and texture. Hydrocolloids can also help preserve food and give them a longer shelf life by preventing the food/ beverage from separating.

The majority of hydrocolloids that are used in food are either developed from plants or animals. Vegan hydrocolloids are used in alternatives to dairy products and alternatives to meat and fish products. Food hydrocolloids are not unhealthy to consume and most of them add dietary fiber to the foods they are used in. Foods that contain hydrocolloids can have less added sugar in them because the hydrocolloids help maintain the taste and texture without the need for excess sugar.  

The below table shows where most hydrocolloids are produced from and as you can see most hydrocolloids are produced from natural sources.

Sourced from Cyber Colloids LTD

Sourced from Cyber Colloids LTD

The below pie chart shows the most common types of hydrocolloids used in food.

Volume of Hydrocolloids.PNG

What Foods are Hydrocolloids Most Used In?

*And Dairy AlternativesSourced from Innova Market Insights

*And Dairy Alternatives

Sourced from Innova Market Insights

Examples of Food/ Beverage with Hydrocolloids:

The following are just a few examples of food/ beverages that contain hydrocolloids.

Store bought baking – Many contain different types of hydrocolloids to help with the texture, moisture retention and size of the baked good.

Beer – Contains carrageenan to help maintain a golden colour and removes the haze caused by proteins in the grains.

Jello – Contains gelatin to give it its jiggle texture

Ketchup – Contains xanthan to help maintain the texture of it

Dairy-Free Milk – Contain vegan hydrocolloids to help increase both the taste and mouth feel of dairy free milk.

Yogurt – Contains locust bean gum to help water from separating out of the yogurt.

Food Hydrocolloids Market Share

Hydrocolloids market share has been rising over the years. As per Zion Market Research, food hydrocolloids had a USD 6.57 billion market share in 2017 and are expected to have a USD 9.12 billion market share by 2024. North America and Europe are predicted to dominate the food hydrocolloids market. The map below shows the usage of food hydrocolloids across the world.

world.PNG

North America and Europe currently have the largest markets of hydrocolloids due to the food and eating trends of the people who live there.

Food Hydrocolloids Trends

Gelatin has been one of the most commonly used hydrocolloids in the world. However, it is not plant-based making it unsuitable for vegan and vegetarian food. Both vegan and vegetarian foods have been on the rise in the last decade with the global vegan food market size valued at USD 12.69 billion in 2018. With the increase in demand of vegan food, substitutes for gelatin have also been gaining popularity among food manufacturers.

The below pie chart shows the market share of the most common food hydrocolloids.

Market Share - Types of hydrocolloids.PNG

As you can see, gelatin, starches and pectin have the highest market share for hydrocolloids in food. We believe as veganism and vegetarianism continue you to rise in popularity gelatin’s market share will decrease.

“The number of new foods and beverages containing hydrocolloids has risen an average of seven per cent a year from 2015 to 2019”
— Innova Market Insights

Key Players in the Production of Food Hydrocolloids:

companies.PNG

Conclusion
Food hydrocolloids are important in the food manufacturing industry as they help food and beverages in different ways. Such as stabilizing, giving a certain texture or mouth feel, providing longer shelf life and maintaining moisture. The majority of hydrocolloids used in food are plant-based making them great for vegan food options. Overall, hydrocolloids are used in the majority of food we consume to improve the quality of the product.

Hydrogen – Fueling the Future

hydrogen-atom-on-white-background-vector-21316030.jpg

As a vocal world leader in climate change, Canada has taken a proactive initiative in navigating a clean energy transition. In more recent times, hydrogen has been dominating the global headlines as a potential vital component of future energy sources. Hydrogen is perceived to be a critical component in combating climate change and creating economic prosperity while achieving climate objectives. In this article, we cover the types of hydrogen power, current hydrogen usage, uses and several Canadian players within the industry.

Overview

Hydrogen is the most abundant element in the universe. It is an energy carrier that can be used to store, transport and deliver energy produced from other sources. Hydrogen is considered a clean fuel as it only produces water when consumed in a fuel cell. Therefore, hydrogen is an attractive fuel option for transportation and electricity generation applications with the absence of carbon as a byproduct.

 
Fun Fact.png
 

Hydrogen fuel today is primarily produced via a thermal process where steam reacts with a hydrocarbon fuel to produce hydrogen. However, this process receives scrutiny as it releases carbon emissions. In addition, hydrogen fuel can be produced via the electrolysis process. Water molecules are separated into its two components: oxygen and hydrogen. Using renewable electricity in the electrolysis process to split water molecules is widely considered the cleanest way to produce hydrogen. There are no direct emissions. Other production methods include biological and solar driven processes.

 
DYK.png
 

Types of Hydrogen

Hydrogen produced today can be classified into the following types:

Kinds of hydo.PNG

In essence, brown and grey hydrogen production still releases carbon emissions, which impedes the decarbonizing purpose of clean energy. Despite that, most of the hydrogen produced today is still brown and grey hydrogen. Blue and green hydrogen are considered clean without carbon emissions. However, they only make up less than 1 per cent of the total hydrogen produced globally.

 
Fun Fact 2.png
 

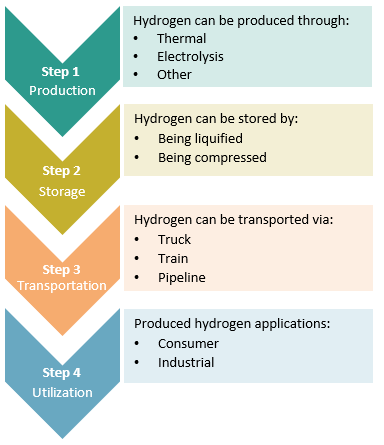
How Hydrogen is Produced, Stored, Transported and Used

 
Process.PNG
 

Uses

As of today, hydrogen is primarily used in the following applications:

Uses.PNG
 
Fun Fact 3.png
 

Mini Case Study: The hydrogen car

In this section, we investigate the pros and cons of a hydrogen consumer car. A hydrogen car converts compressed hydrogen into electricity, which is used to power the vehicle’s motor while only producing heat and water vapour, AKA “emission-free”.

Hydrogen is generally as safe as gasoline we put in vehicle fuel tanks. Although hydrogen is highly flammable, escaped hydrogen dissipates quickly and typically in a narrow column shooting straight up into the atmosphere. Its vapors do not pool on the ground unlike gasoline’s. Hydrogen cars are equipped with an array of hydrogen sensors that sound alarms and seal valves and fuel lines in the event of a hydrogen leak. In addition, hydrogen fuel stations store hydrogen above ground in well-vented areas. Therefore, it presents less fire or explosive danger today.

 
DYK 2.png
 
+-.PNG

Despite the advantages, the main hurdle for hydrogen cars is the relatively high cost in purchasing and maintaining the vehicle, as well as the limited options and refueling stations currently available. In addition, low oil and gas prices are another deterrence delaying the mass commercialization of hydrogen cars.

Fun Fact: It is estimated that 6.5 million hydro fuel-cell vehicles will be sold by 2032, with take-up accelerating due to the growth in fueling infrastructure deployment.

 
Sourced from Research and Market

Sourced from Research and Market


In Our Backyard

A.  Government

Canada committed to reducing its greenhouse gas (GHG) emissions by 30 per cent below 2005 levels by 2030. In addition, the federal government aims to achieve net-zero emissions by 2050, a fairly ambitious goal. The hydrogen industry appears to be a contributing component in achieving these national objectives.

In October 2020, the federal government announced $10 billion in funding for infrastructure initiatives as part of its plan to boost growth and create employment opportunities following the economic impacts of COVID-19. Included in the plans are:

  • $2.5 billion for clean power to support renewable generation and storage and to transmit clean electricity between provinces, territories and regions, including northern and First Nation communities;

  • $2.0 billion for large scale energy efficient building retrofits; and

  • $1.5 billion to speed up adoption of zero-emission buses and charging infrastructure.

The federal government’s hydrogen strategy is seen to rely on a combination of blue and green hydrogen. These funding initiatives would support the continued push to hydrogen fuel as a cleaner energy source.

As natural gas producers, Western Canadian provinces are well positioned to benefit from the hydrogen push. As hydrogen is primarily produced from natural gas, provinces like Alberta and British Columbia already have the necessary core infrastructure in place to capitalize on hydrogen production. It seems like a no-brainer for natural gas producing provinces to produce hydrogen for about half the wholesale cost of diesel by upgrading natural gas or other fossil fuels. This can all be done while capturing the carbon dioxide byproduct, which can be permanently stored underground.

Alberta is seeking to lead the nation’s production of blue hydrogen. In its hydrogen strategy released in October 2020, the province identifies blue hydrogen as a key growth area as part of its economic diversification efforts. The province’s strategy includes large scale hydrogen production with CCUS and deployment of hydrogen fuel in various commercial applications by 2030. It also aims to export hydrogen and hydrogen derived products by 2040.

In provinces with more renewable energy sources like Quebec and Ontario, hydrogen can be produced from the electrolysis of water for about the same price as the wholesale cost of diesel fuel (Corporate Knights).

By 2050, [hydrogen] is going to be a $2.5-trillion industry… We need to keep advancing this sector.
— Dale Nally, Alberta's Associate Minister of Natural Gas and Electricity.

B.  Private Sector

We highlight several key Canadian players with material contributions to our nation’s hydrogen aspirations:

Canada.png
  • Hydrogen Technology & Energy Corp. - Built six retail hydrogen stations in BC (first in 2018), with more currently in progress.

  • Loop Energy - Develops hydrogen fuel cell range extenders for short and long-haul trucks; has secured contracts in China, including converting Nanjing’s municipal bus fleet to 100 per cent

  • Ballard Power Systems - Develops and manufactures hydrogen fuel cell products for various markets including heavy-duty automotive, portable power, material handling etc.

  • Proton Technologies - Developing process to produce low-cost hydrogen by injecting oxygen into abandoned oil reservoirs to combust unswept oil while leaving emissions released underground.

  • New Flyer Industries - North America’s largest transit bus and motor coach manufacturer offers the hydrogen fuel cell-electric Xcelsior CHARGE H2™ heavy-duty transit bus.

Conclusion

Hydrogen fuel appears to have the potential as an alternative energy source in the future; keyword, future. The truth is simple, we still need oil and gas to fuel our nation today. Switching to clean energy sources is not at a flick of a switch and will not be achieved overnight. Instead, it is a gradual process requiring additional investment and R&D before we arrive at this end goal. Hydrogen is a clean alternative and has the potential to play a more prominent role in our nation’s energy production in the future. With the current infrastructure and natural gas expertise, there are opportunities for Western Canadian based oil and gas companies to take advantage of and gradually diversify into this clean alternative energy source.

Sustainable Manufacturing – The benefits are more than being green

Sustainable manufacturing is not a new concept, but it is one that is becoming more important as many countries pledge to reduce C02 emissions and introduce carbon taxes.

DYK.png

What is Sustainable Manufacturing?

Sustainable manufacturing is, as per the US Environmental Protection Agency: manufacturing products through processes that minimize negative environmental impacts while conserving energy and natural resources. Sustainable manufacturing also enhances employee, community and product safety.

Below shows Canada’s expected emission reductions per sector by 2030. One of the largest reductions is from Future Reductions which includes efforts from companies becoming more sustainable.

* Future Reductions:- Efforts to increase clean electricity, greener buildings and communities, electrification of transportation and nature-based climate solutions.- Greater than anticipated clean technology adoption; one possible scenario is highl…

* Future Reductions:

- Efforts to increase clean electricity, greener buildings and communities, electrification of transportation and nature-based climate solutions.

- Greater than anticipated clean technology adoption; one possible scenario is highlighted in the Technology Case, as set out in Canada’s Fourth Biennial Report on Climate Change.

Information sourced from the Government of Canada

Many Canadian companies are already making the switch to more sustainable manufacturing including the following few:

Canada Goose

  • Become net zero by 2025

  • By 2022 end the purchase of new fur and use reclaimed fur

  • Eliminate single-use plastics in all Canada Goose owned or controlled facilities

Rio Tinto, Geocycle Canada and Lafarge Canada

  • Working to reuse waste from aluminium smelting process to make cement

TC Energy

  • Starting construction in 2021 on NOVA Gas Transmission, which is helping the switch from coal to natural gas

Benefits

Sustainable manufacturing can benefit a company in more ways than just becoming green and helping the environment. Becoming sustainable can allow for reduced costs, increased profit margin and the potential to attract new customers.

“We’ve moved past this concept that business versus the environment is a trade-off,” “The business benefits were always there, but more and more companies are going after them.”
— Tom Murray, who advises companies on reducing emissions at Environmental Defense Fund, including Walmart, McDonald’s Corp. and Procter & Gamble Co.

Reduced Costs

At first, becoming more sustainable will mostly cost more money up front but as the years go by the investments tend to pay themselves off. Many governments also offer tax benefits to businesses who become more sustainable, helping offset the initial cost of making the switch to being more sustainable. The Government of Canada allows companies to write off up 50 per cent of eligible sustainable equipment per year on a declining balance basis.

Blub.jpg

Switching to more sustainable manufacturing will help reduce overall costs of running operations. For example, something as easy as changing all the lights to LED light bulbs can help reduce energy bills. Reducing the use of fossil fuels and switching to more renewable energy can help reduce the carbon footprint and therefore potentially reducing carbon taxes for the company.

New Customers

Consumers today are actively seeking out companies that are more sustainable to buy from. A report from Nucleus Research suggest that as of 2019, people are 63 per cent more likely to buy products from companies that are sustainable. These same people are also willing to pay up to six per cent more for products that come from a sustainable company.

Millennials and Gen Z are two generations that prefer to buy from sustainable companies. 73 per cent of Millennials said they are more likely to support sustainable companies. With a buying power of over $140 billion USD, 93 per cent of Gen Z said they would rather buy from a sustainable company. To help attract these new customers, publishing Corporate Social Responsibility reports and advertising being sustainable is key.

The chart below highlights the average amount of transactions per generation and the average cost per transaction. With Gen Z spending the most at an average of almost $21,000 per person per year.

spening.PNG

Increased Profit Margin

Decreased overhead due to becoming more sustainable can lead to increased profit margin. Another way sustainability can help increase profit margin is the reduced waste being produced and less money being used to deal with the waste. Profit margin can also be increased due to the new customers that have been attracted and the potential increase in price these customers are willing to pay.

How to Become More Sustainable

Becoming more sustainable can start small, but there are also some bigger ways to become more sustainable such as reducing waste and using more renewable energy.

Waste Mitigation

Waste mitigation includes reducing or eliminating harmful products such as emissions and toxic by-products that may be produced in the manufacturing process. The manufacturing industry has potential to recycle its own by-products to help reduce waste.

Panasonic is implementing a waste management process to recycle its sludge into dehydrated powered sludge that can be recycled to cement companies.

Switch to Renewable Energy

Wind farm.jpg

There are a few different ways to make the switch to renewable energy sources in manufacturing. One way is making the switch from gas and diesel engines to electric motors, read more about the switch here. Another way to switch to renewable energy is to use more solar or wind power to help run the operation in regions where these renewable energy sources are feasible.

An example of saving money when switching to more renewable energy is Procter & Gamble (P&G). In 2015 P&G built a wind farm in Texas that offsets 100 per cent of the electricity needed for P&G’s Fabric and Home Care facilities in both Canada and the US.

Conclusion

Overall, there are many benefits to becoming more sustainable, the main one being the ability to increase profit margin by decreasing overhead and increasing customers. Though switching to a more sustainable practice may take some time and money, in the end the benefits outweigh the cost. 

The Altman Z-Score and Bankruptcy Risk in the Whitehorn Manufacturing Index.

The Altman Z-Score ("Z-Score") is a formula developed by Dr. Richard Altman that gauges a publicly-traded manufacturer's likelihood of bankruptcy. It was initially created in 1968 and proved useful, particularly regarding predicting bankruptcy two years out (72% accuracy rate with a 6% false-positive rate, under specific conditions).

WHMC Index Z-Score.PNG

Given the impact of COVID and global economic declines experiences in 2020, we felt it was time to review the Z-Scores for our Manufacturing Index. The Score uses five financial ratios to predict a company’s likelihood of going bankrupt. The ratios measure Profitability, Leverage, Liquidity, Solvency, and Activity.

Picture1.png

Liquidity is measured by dividing working capital by total assets (WC/TA) and determining its ability to cover short-term liabilities by comparing its working capital assets to its total asset base. A higher ratio indicates that a more significant portion of the company's assets are current and could be turned into near-term cash to cover liabilities and operating shortfalls.

Leverage measures the amount of retained earnings used to purchase company assets (RE/TA) and shows how reliant a company is on debt to finance its asset base. A company that pays out most of its net income in the form of dividends (or one with negative cumulative net income) would see a much lower ratio than one who uses its earnings to invest in its asset base. A lower ratio means that a more significant portion of the company's assets are financed by debt, increasing bankruptcy risk.

Profitability is measured by a company's EBIT/TA, similar to the return on assets formula. This measure removes the impact of tax and interest from the equation and focuses on operating income instead. The greater a company's ability to generate operating income from its assets reduces the likelihood of bankruptcy.

Solvency shows "how much the firm's assets can decline in value (measured by market capitalization) before the liabilities exceed the asset base and the firm becomes insolvent." While it is true that a high market capitalization can assist a company in reducing its liabilities through additional equity raises, market capitalization can rapidly decline if a company enters financial distress. 

Activity measures the company's ability to generate sales from its asset base (Sales/TA).

[Z-Score = 1.2(Liquidity)+1.4(Leverage)+3.3(Profitability)+0.6(Solvency)+(Activity)]

(GRAPHIC: What does the Score Mean? High Probability of Bankruptcy <1.8; 1.8>grey zone<3.0; Safe Zone>3.0.

Companies with a score of less than 1.8 indicate a high likelihood of bankruptcy, while a score greater than 3.0 indicates a company in a safe zone with a low probability. Companies in the middle are in the grey zone.)

Our manufacturing Index has 59 companies active. Of those, only 18 are in the 'Safe Zone', two of which we discuss below. There are 17 companies in the Grey Zone, with the balance (24) in the danger or high probability zone. We discuss two of those companies as well.

Some observations:

  • Younger or newer firms typically will have lower (or negative) retained earnings, which drags their Z-Scores down. Dividend-paying firms may also have lower retained earnings and lower Leverage scores as a result.

  • In almost all sectors, Solvency is the largest contributor to Z-Score and has the most significant volatility. Investor sentiment heavily impacts the Solvency score – how investors view the business, sector, and even how many investors follow the company.

  • Several companies may become reliant on their ability to raise capital through the equity markets and investor sentiment vs. strong financial performance – See Ballard below.

  • There is a disconnect between some companies Z-Scores and expected share performance this year, which we will further explore.

  • Twenty-four members of our Index have a negative Leverage score, indicating they have negative retained earnings and may be overly reliant on debt to fund asset purchases.

Z-Scores and Solvency Impact:

Since the Solvency score relies on market capitalizations, extreme changes in share prices can significantly alter a company's outlook. We see this in the extreme when we look at the top Z-Scores in our Index – and just how significant the impact market capitalization has.

Picture2.png

In our Index, half of the top 10 Z-Scores are overly reliant on the Solvency score. Four of those would have negative scores if we excluded the Solvency score, meaning its operational and financial performance would be well into the danger zone. All but one has had significant share appreciation (Questor has seen a substantial drop in share value). GPV and BLDP, in particular, seem to be riding a big wave of positive investor sentiment, with BLDP recently completing an equity financing as well. The equity round by BLDP highlights one of the benefits of a strong Solvency score: raising capital in the equity markets. However, the Solvency score can turn quickly, eliminating that ability.

Ballard Power: Investor sentiment driving high Z-Score, leads to equity raise.

While market sentiment is an essential factor in gauging a company's viability and bankruptcy risk, financial performance must ultimately appear before that market sentiment changes. BLDP is currently riding a strong wave of battery, and green, investor sentiment. Its long history of operating losses, leading to significant negative retained earnings, is not a drastic event in and of itself. However, of more substantial concern to our eyes is its material underperformance concerning sales vs. total assets. At an Activity score of 0.23, it is by far the worst performer in our Index, and well below average, and may present a greater risk to Ballard long-term – an apparent inability to generate significant sales from its asset base. Diving even more in-depth, the Liquidity, Profitability, and Activity ratios over time do not demonstrate a substantial reversal in financial performance. With over $268 million in net working capital at the end of Q2, 2020, and its recent ATM equity raise of $250 million, BLDP does represent a low risk of bankruptcy as it has significant balance sheet strength. The company has a large runway to improve financial performance and demonstrates the benefit of a high Solvency score, raising additional capital. 

Tree Island: low investor sentiment, declining Activity scores punctuate weakening Z-Score.

Tree Island, a small-cap manufacturer of wire products, shows the challenges of the Z-Score from the opposite perspective of Ballard. Like Ballard, Tree Island has a negative Leverage Z-Score but has a much lower Solvency score due to a low share price and low market capitalization. TSL, unlike Ballard, does have above-average Liquidity, Profitability, and Activity scores. Tree Island's Leverage score is also negatively impacted by its dividend payout, which reduces the amount of retained earnings available to fund assets. Also, concerns and trends to keep an eye on are the declining Activity scores and declining liquidity.

Shawcor Ltd.: Investor sentiment lowest in Index, covenant renegotiation required to avoid the Z-Score predicted fate.

For those of you familiar with Shawcor specifically or the energy sector in general, you are aware of some of the financial challenges faced by companies active in the industry. Shawcor is no exception. While the Shawcor emerged in 2017 in a "safe zone," according to the Z-Score, warning signs quickly appear. In 2018 we saw a substantial drop in Z-score, partially contributed by a decline in profitability, and a reversal in investor sentiment and declining market capitalizations. As sector and company performance declined in 2018 through the current period, investor sentiment rapidly eroded and compounded the effects on the Z-Score. COVID has undoubtedly assisted in the declines, but the signs were already there. Also, we want to highlight Shawcor as an example of the risks associated with Z-Scores with heavy reliance or contribution from the Solvency component. While Shawcor was not the most reliant historically, it shows how quickly investor sentiment and market forces can turn on a company, making access to capital very challenging, especially when needed.

Shawcor ceased paying its dividend in March of 2020 and renegotiated its credit facility's terms in July 2020, with covenant relief through December 31, 2021. This relief will help the company attempt to stave off bankruptcy as it works through its financial challenges. The Z-Score predicted Shawcor was trending downwards and in trouble at the end of 2019.

Hammond Power Solutions Inc.: Strong component scores not supporting higher investor sentiment

Our final component review is HPSa.TO, another small-cap business with above-average performance across the board… except its Solvency score, which is well below average, ranking in the 43rd percentile. Hammond is in the top quartile for all Z-Scores in its Leverage, Profitability, and Activity scores, making it one of the few companies reliant on a strong Solvency score to fuel its 'safe' Z-Score rating. Of our entire Index, only 18 companies are in the "Safe Zone," including Hammond. Of those, Hammond's Solvency score contributes 16% to its overall Z-Score, by far the lowest contribution by these Safe Zone companies. The next closest – Circa Enterprises –has a Solvency score contribution of over 26%. Hammond is the least reliant on positive investor sentiment or market capitalization drivers and more reliant on its financial operations and performance of the Safe Zone companies.  

Conclusions: Z-Score is useful, but like all financial ratios, doesn't tell the whole story

The Z-Score is just one tool to assess publicly traded companies and their associated risks. By looking at the individual components that make up the Score, we can narrow our focus and learn what factors may be driving both company and market performance. We highlighted four companies from our Index above, including Ballard with the highest scores, Tree Island with one of the lowest, Shawcor as one of the more distressed in the Index, and Hammond Power, a potentially overlooked investment opportunity

Picture7.png

The opposite holds for Shawcor as the capital markets are not overly optimistic about the energy sector or Shawcor's outlook. Shawcor has a dismal Solvency score, indicating its challenge in securing additional capital to reduce debt exposure.

Where we see exciting opportunities are in Hammond and Tree Island for similar reasons. Both are small-cap firms, and top tier performances in Activity – showing an ability to generate sales from their assets. Both are top half in Liquidity scores, indicating an ability to cover near-term obligations, and both are bottom half in Solvency scores. A low Solvency score can indicate extreme investor concern (like Shawcor) or indicate investors overlook these firms due to their small-cap nature. Tree Island, with its low Leverage score and bottom half Profitability score, carries significantly more risk than Hammond and its more substantial scores across the board. Ultimately we see a disconnect between Hammond and Ballard's respective share performance and its Z-Score component make-up. When we dive into forecasted earnings, the market's expectations for Ballard are somewhat lackluster, with no expectation for positive operating profit in the next three years. Ballard is riding a strong market wave of interest in improved battery power and green investment/sentiment, yet actual performance continues to elude it.

Hammond, like many small-caps, has no forecast estimates. However, it may be an overlooked opportunity given it is one of only four companies in the Safe Zone that performs in the top half of all financial Z-Score components (the others being BOS.TO, XTC.TO, and PFB.TO). It is also the only company in the Safe Zone below average in its Solvency score, meaning its market capitalization underperforms our Index. For interest sake, Hammond's share price is down 22% this year, and 27% below its 52-week high.

Let’s Talk Canadian Federal Government Debt

We have grown concerned about the dramatic increase in government spending in Canada. Even prior to the pandemic the federal government and many provinces were running at record levels of spending and deficits, which was pushing total debt levels well over historic highs. The pandemic stimulus efforts have taken the deficit spending beyond levels imaginable. We have reviewed several articles and statistics that economists and the government use and have pulled together the most interesting facts to put the spending, deficit and debt levels into perspective.

Federal Spending per Person

The Fraser Institute is currently quite focused on our topic. They produced a full report on spending by prime minister in May 2020. The chart below provides a great review of spending per year, by prime minster. Unsurprisingly, the largest increases in spending (outside of World War II) have been while a Trudeau is Prime Minister. Since the report was published, the Federal Government released its fiscal update on July 8 and the projections from May were way off. Federal spending per person is now expected to reach $15,596 in 2020, approximately 18 per cent more than expected in May.

Photo from Fraser Institute

Photo from Fraser Institute

Federal Deficits – Actual Dollars

As you can see below, the current year’s (2020/2021) deficit is like nothing we have seen this century.

Source: Department of Finance, Canada

Source: Department of Finance, Canada

How did this happen? As presented in the timeline below, deficit spending was the plan all along. However, even prior to COVID, the federal deficit had jumped from $19.8 billion to $26.6 billion or 34 per cent. Once COVID hit, estimated spending ballooned to $343 billion and is now loosely estimated to exceed $400 billion.

Timeline.png

As Chris George mentioned in his August 28 editorial - the current Liberal Government has outspent all past federal governments, including those governments that had to respond to world wars and global recessions. The most recent fiscal snapshot suggests the federal government was unlikely to balance the budget until at least 2040 (and this was assessed before COVID-19 measures).

Total Debt Increase in 2020

The COVID-19 pandemic is a global economic disaster. Almost every region of the world has been impacted. However, not all federal governments have responded by spending at the same level as Canada. The average increase in total debt per capita expected by G7 countries this year (excluding Canada) is approximately $2,500 per person. Canada’s increase in total debt per capita is planned to be $6,200 per person. The US has also increased its total debt per capital significantly this year – by almost $10,000 per person. The following chart shows the expected total debt increase per capita from 2019 to 2020 by each G7 country. 

Sources:Debt Info from Source: International Monetary Fund | April 2020;Population info from The World Population Review - https://worldpopulationreview.com/

Sources:

Debt Info from Source: International Monetary Fund | April 2020;

Population info from The World Population Review - https://worldpopulationreview.com/

To give a different perspective of the above data, the following chart shows the 2020 total debt level for each of the G7 countries. The increase from 2019 is highlighted and the per cent change is noted at the top of each bar. 

Sources:Debt Info from Source: International Monetary Fund | April 2020;GDP info from The World Bank - https://data.worldbank.org/indicator/NY.GDP.MKTP.CD;Population info from The World Population Review - https://worldpopulationreview.com/

Sources:

Debt Info from Source: International Monetary Fund | April 2020;

GDP info from The World Bank - https://data.worldbank.org/indicator/NY.GDP.MKTP.CD;

Population info from The World Population Review - https://worldpopulationreview.com/

Why has Canada spent so heavily? Was Canada and the US disproportionately impacted by the pandemic?  Are Trudeau and Trump spending fiends?

We believe both governments decided to use the debt spending as a tool to offset the economic crisis that resulted from the pandemic shutdowns. It was an “easy” tool to use and the downside was not likely to be catastrophic based on the experience of countries with very high debt loads, like Japan and Italy. However, one could ask how much of this “tool” should we use now? Its availability is a result of years of prudent financial management and an economy that has provided stable gross domestic product growth over generations. Do we want to become like other countries in the world that have used their ability to borrow already? The higher the debt, the higher the cost of the interest for future generations. Future Canadians will pay the price with reduced services. However, with interest rates expected to stay near 0 per cent for many years – the future cost of the increased debt is not currently of grave concern. The chart below shows Debt as a percentage of GDP for the G7 countries from 2015 to 2020. Relative to the other G7 countries, Canada’s total debt level is quite a bit lower – even after the spending binge of the last four months.

Based on the projections provided to date, the federal debt will exceed $1.2 trillion by the end of the current fiscal year. It is likely to be even higher once Trudeau’s upcoming spending plan and budget is released. Based on the relative data compared to other G7 countries – Canada can endure more deficit spending in the short term, but we need to ask ourselves are we getting value for the spending? What are we spending our “rainy day” fund on? Will it spur the economy in such a way that we grow our way out of the economic issues? Will our lives be better because of this spending? We suspect the government is going to pose that question to us in the coming months… How will we respond?

The Future of Food Manufacturing

The future of food manufacturing is here. Many manufacturing companies, including food manufacturing companies have started to transition to Industry 4.0, which can help improve many parts of a manufacturing business. The transition of food manufacturing to Industry 4.0 is known as Food Manufacturing 4.0.

The recent pandemic has fueled the transition to Food Manufacturing 4.0 to gain flexibility and efficiencies. Over the past months the food manufacturing industry has undergone many challenges due to the pandemic, in particularly supply chain disruptions and a labour shortage. As a result, food manufacturers are more motivated to transition to Food Manufacturing 4.0.

What is Industry 4.0/ Food Manufacturing 4.0

Industry 4.0 is the enhancement of automation and data exchange technologies in the manufacturing process. This can include adoption of current AI and IoT technology through out the operations, in the machinery, the warehouse and for the workers so that every aspect of an operation can collect data and “talk” to each other.

There are many different ways to add AI and IoT into your current manufacturing system, such as low-cost sensors and field devices embedded with inexpensive microchips. The sensors can not only track production but also measure temperature, ensure consistent quality, balance inventory with demand and many more.

These sensors and microchips can then send the information/data to a few different types of mechanisms depending on an organization’s needs:

  • Monitoring – The data is sent directly to an operator for the operator to analyze.

  • Automation – The data is sent to computers / cloud to analyze, which then acts upon the insights allowing for the fastest responses without human intervention.

  • A mix of the two – The data is sent to computers / cloud to analyze to provide insights and then a human worker can act upon the insights.

The different mechanisms can be combined based on the organizations needs.

“The goal is to gain better insight into your machines and your factory. Save time, energy, frustration, and money by knowing something is not right with your machine before it goes down. Industry 4.0 in food manufacturing can be incredibly helpful!”
— Graham Immerman, VP at MachineMetrics

For more information on AI and IoT, check out our Artificial Intelligence Of Things blog.

Food Manufacturing 4.0: Supply Chain, Labour Shortages and Increased Efficiency

Supply Chain

The pandemic has caused drastic changes in the food manufacturing supply chain. With Food Manufacturing 4.0 implemented, AI can predict disruptions before they happen and help choose the best course of action to reduce risk. These predictive analytics will help provide insight that managers can utilize to keep the company nimble and ready. AI can also help maintain accurate inventory and the handling of cash flow, which, during a crisis, is ever important.

Inventory sensors for warehouse management can help ensure proper inventory tracking. Sensors can alert workers when supplies are low so more can be ordered before they run out. Alternatively, the IoT can automatically reorder items that are low without having human review , making the process even faster and more efficient. Technology can also predict when to order product based on past supply and demand history.

“These technologies might create the impression that Industry 4.0 requires significant capital investment from businesses. Actually, that doesn’t need to be the case. Instead, the key may lie in applying the latest specialist technologies, like sensors, as part of a low-cost digital retrofitting strategy.”
— Claudia Jarret, Manager of EU Automation

Labour Shortages

Even prior to the pandemic, many food manufacturing plants had productivity issues related to  sick or unproductive workers. Introducing IoT and automation can lead to a safer workplace which could mean less production disruption and more profits..

One suggestion to keeping workers safe is wearable technology such as smartwatches, smart gloves or smart glasses that would allow for real-time monitoring of workers’ health. If wearable technology seems too advanced or pricey, companies can also install body temperature sensors within production facilities that would flag workers with body temperatures exceeding a predetermined threshold. With real-time monitoring, body temperature can be easily monitored to pick up signs of illness. Catching a worker’s illness early could help reduce the spread of the illness, therefore reducing the chances of having a material disruption in labour efficiency. Another cost-effective way to implement wearable technology is utilizing the smartphones that the majority of workers already use. By installing a simple  health monitoring app that can be customized to the wearer and the business specifications.

For instance, Riverside Natural Foods, parent company of Made Good, Good To Go and Cookie Pal introduced wearable technology during the pandemic to ensure social distancing and to trace which employees have come into contact with one another. The app is downloaded to the workers’ phones and vibrates if the worker is less than six feet away from someone else.

Overall Efficiency

Food Manufacturing 4.0 can create overall efficiency for a food manufacturer. For example, sensors can help detect bacteria and viruses that are present on food which may automatically trigger ultraviolet lights to kill bacteria and sanitize surfaces to reduce cross-contamination. The food that has been detected as bad can then be removed from the line, thus reducing the risks and costs associated with product recalls.

This technology can also help food manufacturing companies become more environmentally friendly, by automatically tracking waste and energy usage. Sensors can pinpoint the hotspot(s) of where waste is occurring, the reason why the waste is occurring and act upon it to stop it from continuing. Fewer resources need to be used to meet regulations and less food is wasted, thus reducing overall expenses.

Food manufacturing 4.0 can also help notify workers when maintenance needs to be done on machines and conveyors to reduce the chances of things breaking down and disrupting production. One way the technology can help predict the need for maintenance is from sensors detecting changes in the way things are operating, for example, if a part is vibrating more than normal. The sensors can then send this information to a computer/ cloud to notify a repair crew that maintenance is needed.

Conclusion

The possibilities for Food Manufacturing 4.0 are endless, and the potential savings are potentially significant. Some business owners may be concerned about the cost of implementing Food Manufacturing 4.0, but we are confident a basic cost-benefit analysis considering long term impacts will show the benefit far outways the risks. Another way to reduce the upfront costs of implementation is to start small, begin with some basic IoT that would most benefit the operation and gradually introduce enhancements and improvements as the workers and management become familiar and accepting of the changes. Food Manufacturing 4.0 may sound daunting for some, but the future will show it is a necessary step to stay competitive and stay profitable in the food manufacturing sector.

Shopify Part Two

In this second part of our Shopify series, we investigate the e-commerce solutions provider’s rise to being the largest Canadian company by market cap and its current valuation. We compare Shopify to both other large Canadian companies and its e-commerce peers to justify its current valuation.

Shopify began 2020 with a market cap of $60.3 billion. COVID-19 resulted in the global economy shutting down in mid-March, with global stock markets taking a hit due to the widespread economic impact. Like other e-commerce companies, Shopify experienced a surge in demand for its services as both customers and retailers focused more on e-commerce during the pandemic. On May 5th, 2020, Shopify overtook the Royal Bank of Canada (RBC) as the largest Canadian company by market cap. As of August 26, 2020, Shopify had a market cap of $171.9 billion, $27.6 billion more than RBC. Shopify’s substantial 185% increase outperformed RBC’s -3% return year-to-date.

1.PNG

We now compare the top five Canadian companies by market cap.

Information retrieved from Thomson Reuters Eikon on August 26, 2020.

Information retrieved from Thomson Reuters Eikon on August 26, 2020.

Despite leading all Canadian companies in market cap, the other metrics tell a different story about Shopify.

Shopify ranked sixth in terms of enterprise value. The company’s enterprise value lagged TD, RBC, Brookfield Asset Management ($355 billion), Bank of Nova Scotia ($244 billion) and just nosed out Enbridge. The enterprise value of these major Canadian companies indicate that their operations are funded with a larger portion of debt, as compared to Shopify which is predominantly equity funded.

From a trailing twelve-month (TTM) revenue perspective, Shopify ranked 89th out of all Canadian public companies with $3 billion in revenue (113th based on 2019 revenue). This is significantly smaller than the top five TTM revenue Canadian companies: Brookfield Asset Management ($88 billion), Alimentation Couche-Tard ($74 billion), Great-West Lifeco ($52 billion), George Weston ($52 billion) and Loblaw Companies ($50 billion).

Shopify reported $5 billion in total assets in its most recent quarter. Based on this metric, the company ranked 138th out of all Canadian public companies. The five companies at the top of the rankings: RBC, TD, Bank of Nova Scotia ($1,086 billion), Bank of Montreal ($852 billion) and Manulife Financial ($509 billion) reported total assets that dwarfs Shopify’s.

Looking at employment statistics, Shopify reported 5,000 full time employees in its most recent quarter, ranking 92nd out of all Canadian public companies. The largest public Canadian employer was George Weston, with 194,000 full-time employees reported. When compared to the top five market cap companies above, TD is the largest employer with just under 90,000 employees or nearly 18 times more employees than Shopify.

Valuation

We use three market valuation methods to compare Shopify to its peers: EV to revenue (EV/Revenue), EV to EBITDA (EV/EBITDA), and Price to Earnings (P/E). We first compare Shopify’s valuation to the top five market cap companies in Canada. In addition, we compare Shopify to other publicly traded e-commerce companies.

A.      EV/Revenue

3.PNG
4.PNG
5.PNG

Shopify’s Canadian peers are currently trading within a 3x and 10x EV/Revenue range. These blue-chip comparable companies are matured and have demonstrated a track record of consistent profitability. On the other hand, Shopify is a growth-oriented company. Since its 2015 IPO, the Company has experienced a compound annual growth rate (CAGR) of 63.9% on revenue. Growth companies tend to trade at a premium compared to matured companies.

To justify its trading multiple premium, we compare Shopify’s to leading e-commerce companies. We incorporate the forecasted revenue growth of each company to support our EV/Revenue analysis. Despite Shopify’s forecasted 2020 revenue growth to double both Amazon’s and Alibaba’s, Shopify’s 2020 EV/Revenue is 11 times Amazon’s and 5 times Alibaba’s respectively. When compared to ETSY’s 88.5% forecasted 2020 revenue growth which outpaces Shopify’s, ETSY is currently trading at 9.8x 2020F Revenue, 5 times less than Shopify’s.

Based on our findings, we fail to justify Shopify’s current EV/Revenue multiple. We believe the current valuation is not sustainable. The stock is clearly overbought, likely due to the continued increase in e-commerce adaptation, which has been further fueled by COVID-19. In addition, the software and technology sector has been on a historic tear in the public markets over the past six months, likely due to the perceived business resiliency as compared to other sectors which are more vulnerable to the prolonged economic impacts of the pandemic. This momentum investing in Shopify will likely decline going forward, which will cause a decline in demand for its shares. With the forecasted revenue growth rate declining over the next three years as well, we expect Shopify to trade at a lower EV/Revenue multiple as compared to its current level.

B.      EV/EBITDA

For the TTM period, Shopify reported negative EBITDA. Therefore, our EV/EBITDA comparison factors in fiscal 2020-2022’s forecasted EBITDA as per analysts’ consensus.

6.PNG
7.PNG
8.PNG

As seen in the EV/EBITDA comparisons above, Shopify is currently trading at a materially steep premium compared to its peers. While the EV/EBITDA multiple falls as forecasted EBITDA increases over the forecasted period, Shopify is not trading within a reasonable range as seen in both its Canadian and e-commerce peers. Even if 2022’s forecasted EBITDA is expected to double 2021’s, the 215x EV/EBITDA is still an outlier. Therefore, we deem Shopify’s current trading EBITDA multiples to be meaningless. As much of its enterprise value consist of its market cap, we believe this further supports our claim that Shopify’s stock is currently overvalued by momentum focused investors with little regard for fundamental valuation measures.

C.      P/E

Shopify reported negative earnings per share (EPS) in the TTM period. Therefore, our P/E comparison is forward looking, based on fiscal 2020-2022’s forecasted EPS as per analysts’ consensus.

9.PNG
10.PNG

Shopify is forecasted to report positive EPS for the first time since inception at the end of fiscal 2020. Based on the current P/E multiple, investors are willing to pay $449 for each dollar of its 2020 forecasted earnings. We believe this current valuation is inflated and meaningless to compare to its Canadian peers.

As expected, Shopify’s e-commerce peers are currently trading at higher P/E ratios, a common theme among the e-commerce industry especially during COVID-19. Amazon with a 2.3 trillion market cap has experienced a 90% market cap increase year-to-date. Amazon’s growth prospects are diverse as well, with its evident success in its non-e-commerce segments such as Amazon Web Services (cloud services), Amazon Go (convenience stores), Amazon Prime Video (video production and streaming) etc. Shopify is expected to grow earnings by 50% in 2022, compared to Amazon’s forecasted 43%. Despite that, Amazon is currently only trading at 109 times its forecasted 2020 EPS. Despite Shopify’s near-term growth prospects, we find it hard to justify that the company is worth four times as much as Amazon’s 2020 forecasted P/E. Even with the earnings growth in 2022, Shopify would still be trading at 312 times compared to Amazon’s forecasted P/E of 54 times. This further proves that Shopify is currently materially overvalued from a comparable standpoint.

Equity Raising

Our opinion that Shopify is overvalued is further supported by Shopify’s recent actions in the capital markets:

  • May 12, 2020: Raised $1.5 billion in equity by selling 2.1 million class A shares, with the net proceeds used to strengthen its balance sheet and to fund future growth strategies.

  • July 28, 2020: Filed a US$7.5 billion mixed shelf registration, giving Shopify the right to sell a variety of securities including its Class A shares, preferred shares, debt securities and warrants.

Public companies’ equity issuance can be perceived to be a negative signal where management believes the company’s shares are overvalued. In Shopify’s case, it can be argued that its recent capital raises are hot on the heels of its significant share price appreciation over the past eight months, and management has indicated the funds will be geared towards further growth initiatives which includes: potential acquisitions; continued investment into its warehouse fulfillment network; its Shop app intended to further connect end customers and merchants; Shopify Studios, its media production subsidiary.

What Should Shopify’s Share Price Be?

We seek to determine what Shopify’s shares are worth based on public comparables. In our analysis, we use the e-commerce peer group’s average as a benchmark to determine the implied share price of Shopify. We use the forward looking 2022 forecasts for our analysis, the fiscal year where Shopify is expected to experience higher growth. Our analysis is provided below:

We begin by calculating a revenue and EBITDA multiplier based on Shopify’s growth, which exceeds the peer group average:

11.PNG

Based on Shopify’s above average revenue and EBITDA growth, we apply the growth multiplier to 2022’s peer group average trading multiples to obtain Shopify’s implied trading multiples:

12.PNG

Based on the implied multiples calculated, we predict Shopify’s enterprise value and market cap as follow:

13.PNG

Our analysis indicates Shopify’s share price within a range of $580 - $685, which would represent a 52-59% decline compared to its $1,431 closing price on August 26, 2020.

Overvalued

Based on our analysis, we believe Shopify is currently overvalued from a fundamental perspective. We predict its share price to fall by more than half to our forecasted $580 - $685 range. We believe that as an IT services company, Shopify would command a higher valuation than the average Canadian public company. However, our analysis indicates that Shopify’s current valuation is dramatically higher than even its e-commerce peers to a point that we deem its current trading multiples as irrelevant for comparison purposes. Despite its near-term growth prospects, we were not able to find adequate support to justify its inflated valuation today. We predict that Shopify’s share price will fall from its current levels once momentum investors stop seeing weekly stock price appreciation. We see a decline in its market cap and enterprise value from current levels when the hype surrounding its stock wanes and when its growth slows below current expectations.

The last three companies to overtake RBC as the largest Canadian company by market cap are Valeant Pharmaceuticals (2015), BlackBerry (2007) and Nortel Networks (2000). All three companies were not able to sustain the number one ranking for long, with a steep decline in market cap following shortly after as momentum investors lost interest in these respective companies, as well as other company specific issues. We’re adding Shopify to this list and are predicting a steep share price correction in the next 12 months. Short-sellers, we smell blood… 

A Post COVID-19 Business World

Is your business heading back to the office soon? Are you contemplating keeping your team remote? Have you prepared your office space for the return of your employees? Are you planning on cutting business travel?

Many countries have put safety measures in place to ensure they do not receive another large outbreak of COVID-19. Some of these precautions include staying six feet apart, wearing facemasks in public and washing hands as often as possible. The world has changed as we know it, and we believe the post COVID-19 business world will look different.

“We will not go back to what life was like before January of this year.”
— Theresa Tam, Canada’s chief public health officer

Working Remotely

During COVID-19, many companies were able to set-up their workers remotely and some of those companies will be keeping it that way. Remote working tools such as Zoom, Microsoft Teams, Google Drive and similar applications made remote working possible. Some of the pros and cons to keeping employees working remote are below.

Pros

  • Reduced risk of spreading COVID-19 and other viruses and colds among staff.

  • Cost savings: according to Global Workplace Analytics, employers can save USD $11,000 a year per employee that works remotely due to using less or no office space.

  • Some employees work better from home and are more productive and happier.

  • A more casual atmosphere.

Cons

  • Lack of routine for some staff.

  • Less team interaction.

  • Some employees work better at an office.

  • Hard to have a work/home balance.

Stayin remote.PNG

Post COVID-19 Office Space

For companies that plan to head back into their offices, it may be very different than before. Large boardroom meetings could be a thing of the past. A few measures should take place before employees head back into the office, along with other precautions that may stay for the foreseeable future.

Before Heading Back to the Office

  • Establish protocols to reduce potential virus spread

  • Post external signs indicating new office protocols

  • Provide employees with everything they need to keep their work surfaces clean, including disposable wipes, hand soap, paper towels, disinfectants, and alcohol-based sanitizers

Once Back at the Office

  • Screen employees to ensure they are healthy

  • Reduce the number of employees on site through alternating workdays or shifts

  • Train staff on proper hygiene procedures

  • Limit capacity of shared spaces - especially bathrooms, elevators, lunch rooms and kitchens

  • Have the tables and counter tops disinfected and cleaned regularly. 

  • Communicate weekly with your employees to ensure compliance

“We want to make sure employees are getting temperature checks, masks are readily available and deep-cleaning processes are in place for meeting rooms.”
— Greg Montana, Chief Risk Officer at Fidelity National Information Services

The Future of Office Spaces

Although there will be some quick fixes, as mentioned above, to help reduce the spread of viruses, the long-term changes to office spaces could include the following:

  • Having a sink at reception for everyone to wash their hand upon entering

  • Open concept offices may be less popular due to not being able to social distance

  • Air filtration that use ultraviolet light

“Workstations were about privacy and acoustics - now they represent a physical separation between colleagues”
— Brent Capron, interior design director at Perkins and Will

Business Travel

Traveling for business may never be the same in the post COVID-19 world. Business travel is expected to be minimal for the next year or two. Many Canadians are also unwilling to travel, with 57 per cent of Canadians unwilling to go to a business conference until a vaccine is available.

Ben Baldanze, former CEO of Spirit Airlines estimates that there will be a five to ten per cent permanent decrease in business travel. Baldanze explains that as many teams worked from home and were unable to travel for business, they found other ways to communicate with clients/employees.

“Businesses will re-evaluate whether travel is fundamentally required. In cases where it is, a firm will have to sponsor an employee or executive to travel knowing the risks, like that they might be burning money having to put them up at a luxury hotel during a 14-day quarantine.”
— Dale Buckner, CEO of Global Guardian

Conclusion

In a post COVID-19 business world there will be a new normal. More companies and employees will work remotely or set schedule to go into the office. The office atmosphere may be different, with a high focus on staff health and hygiene procedures. Business travel will look different, with less business spending money on travel. Over time, things may return closer to what they were before COVID-19, but they will never be the same.

Case Study: The Shopify Surge


85 per cent - the increase in Shopify’s stock price this year as at June 5, making it the best performing stock on the TSX year to date. The origins of the company’s name are: to shop and to simplify. Shopify’s increasing e-commerce dominance is fueled by its ability to provide small and medium sized businesses worldwide with a user-friendly and cost-effective e-commerce platform. In this first part of our Shopify series, we provide an overview of Shopify and its success in becoming one of the largest e-commerce platforms in the world.

E-commerce Solution

Ottawa based Shopify offers an avenue to build an e-commerce presence through a simple, four step process:

Chat.PNG

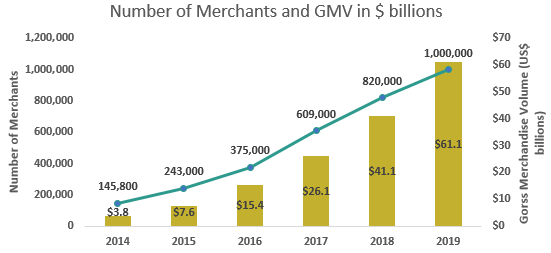
In the past, laying down the foundations of an e-commerce store was not easy for business owners. With Shopify, merchants can offer their products and services online at an affordable cost. The chart below demonstrates the rapid adaptation of Shopify as businesses seek to increase their e-commerce presence.

Graph.PNG

Shopify’s History

Shopify was initially a solution to a problem the founders experienced. Before being a platform to build e-commerce stores, the original Shopify was a store itself known as Snowdevil. It was founded in 2004 to sell third party snowboards online. After getting increasingly frustrated at the lack of available software in the early 2000s to launch their e-commerce snowboard shop, the founders took matters into their own hands and launched Snowdevil via a Shopify barebone platform.

The initial response to Shopify itself was far more overwhelming than for the Snowdevil e-commerce store. The founders decided to shelf Snowdevil and focus on assisting other merchants pursuing e-commerce instead. Shopify was officially launched in 2006.

Since then, Shopify has grown rapidly. We highlight several key milestones along the way in the timeline below:

Timeline.PNG

Business Model

Shopify generates revenue in two ways:

A.    Subscription model

Customers can choose between three subscription plans: Basic Shopify, Shopify and Advanced Shopify.

Shopify level.PNG

Shopify also offers Shopify Plus, a subscription plan tailored to larger businesses with higher volume sales. Think of Shopify Plus as the enterprise grade solution for e-commerce. The pricing of Shopify Plus varies by customer.

B.    Merchant Solutions

In addition to varying features, each subscription plan charges varying payment processing fees. These consist of transaction fees, referral fees, credit card rates and point of sale (POS) fees. As seen below, Shopify’s merchant solutions revenue has seen an uptick along with the increase in sales processed.

Rev by quarter.PNG

Shopify has successfully built a sustainable Software as a Service (SaaS) business model on subscription fees and revenue growth based on customer transaction volume.

Customers

Over the years, Shopify has successfully increased its customer base exponentially. Its current customer base consists of a diverse set of companies and brands, including:

Company-Brand.PNG

Other notable Shopify customers include Budweiser, Sephora, Tesla, Nestle’s Nescafe, Red Bull, MVMT, World Wildlife Fund Canada, Los Angeles Lakers Store, Manitobah Mukluks, Kylie Cosmetics… The list goes on and on.

“The whole reason to go to Shopify Plus was to best serve our customers. It wasn’t about reaching a certain turnover; it was about providing a seamless experience. We wanted custom checkout, we wanted automation tools, and with the Plus platform you have that out of the box.”
— Adison Rudall, Co-founder of P&Co.

Anticipating Customer Needs

Shopify’s competitive advantage is its ability to anticipate what customers want and respond swiftly, which has enabled the company to distinguish itself from its competitors. Management understands the importance of being proactive to address customer needs for business sustainability and growth.

“We view Shopify Plus as a partnership. We felt the relationship was the strongest it would be out of any player that we could have chosen. We understood that the platform is continually going to get better. At the end of the day, performance and everything aside, we feel like we’re in this together.”
— Andy Lee, Senior Director – Digital Product Management, Staples Canada.

In 2020 alone, Shopify introduced additional features and services to make it even more convenient for its merchants. Some of the offerings are highlighted below:

A. For Shopify merchants

  • Shopify Balance: Business accounts, similar to what traditional banks offer but with no monthly fees and no minimum balances.

  • Shopify Card: Physical and virtual cards for merchants to buy inventory, track spending or conduct ATM withdrawals.

  • Shopify Capital: Offering cash advances between $200k and $500k in Canada and US$200k and US$1M in the US; $1B allocated to date.

  • Collect tips: Merchants can collect tips from consumers online.

  • Shopify POS: Offering merchants contactless payment hardware in physical retail locations post-COVID.

B. For customers of Shopify merchants

  • Buy now, pay later option: Allows consumers to pay for products purchased in installments.

  • Shopify POS: Customers have access to what merchants have available in-store via the website.

  • Local pickup: Enable merchants to offer customers curbside pickup services.

  • Gift cards: Allows merchants to sell gift cards to their own e-commerce stores.

Business owners appreciate the company taking the initiative to introduce industry leading services to their e-commerce stores. They also witness the impact of these offerings to the continued growth of their businesses over time. This has enabled Shopify to build an entire e-commerce ecosystem that its loyal customer base increasingly relies on.

“Shopify tries to be the best possible piece of software that you could add to your business, if you are a retail business. Trying to solve, ideally, every problem that you might encounter along the way, that can be solved in digital means, in such a way that you can focus completely on your relationship with your customers and your products, and be successful this way. “
— Tobi Lutke, Shopify Co-founder and CEO

Shopify’s success stems from its focus on customer satisfaction. The company strives to offer a convenient, user-friendly solution to business owners at a reasonable cost. Its pursuit of customer satisfaction is further evident in its continued efforts to anticipate future customer needs.

In the next part of our Shopify series, we investigate Shopify’s surge to the top of the Toronto Stock Exchange. We compare Shopify to the top Canadian companies as well as its competitors within the e-commerce space. We aim to provide insight on its current valuation and how sustainable this is going forward.

Check out part two here.


Did you know? Whitehorn are experts in acquisition mandates. The Whitehorn team has decades of experience assisting and advising Western Canadian companies in acquisitions to accomplish their goals.

Contact us today to find out more!

What’s Next for Canadian Retail

The Canadian retail sector was battered and beaten coming into 2020. The effects of online shopping, high household debt and reduced consumer spending had the sector contracting by an estimated 1,000 retail locations and this was before pandemic related issues. The COVID-19 pandemic has brought a series of additional challenges: many retailers endured forced closure, reduced operating hours, restricted customer capacity all while covering rent payments, severance and increased cleaning costs. 

Closing since COVID2.PNG

The sector is in the midst of the largest change since general stores made way for department stores. Despite record grocery sales, retail sales in Canada plunged 10 per cent in March 2020 compared to February 2020 – and March did not have a full month of forced pandemic closures. Overall, Canadians spent just $47 billion at retailers in March, it was the worst sales in one month since 2016. Statistics Canada expects April’s numbers will be worse, much worse. Current expectations are for a further 15 per cent decline in April. It could bring the spending level down to 2013 levels, according to TD Economics, as presented in the chart below. 

 
Source: TD Economics

Source: TD Economics


Not all sectors are being punished. While pretty much all retailers deemed non-essential are on their heels and taking losses – the “essential services” retailers that remain open are benefiting big time. Food & beverage and general merchandise (non-food grocery and drug store items) experienced near record positive numbers in March. Grocery related food and beverage shot up over 23 per cent while clothing was down over 50 per cent.   

Sector Performance.PNG

But the Sector is Hanging On

The general economic data is catastrophic. It now appears likely that the Canadian economy will retreat by about 20 per cent (annualized) in the Q2-2020 and the national unemployment rate spiked to just under 14 per cent in April, compared to eight per cent in March and about triple the 12-month average of 5.7 per cent. 

Industry experts suspect nearly all “non-essential” retailers have sustained significant losses over the last couple of months and are expected to continue to manage puny profits for many months to come. Authorities are slowly easing restrictions across the economy and many provinces have cautiously reopened retail establishments but at reduced capacity and with increased costs for cleaning and staffing. All retailers will need to adapt to survive. Since mid-March, many firms have been forced to cut their employee base, close locations and some using bankruptcy protection to hold off their creditors. Experts believe these formal announcements are the “tip of the iceberg” and most major retailers are currently planning “restructuring” of some kind. 

“Some retailers will hold off filing for bankruptcy until physical stores are permitted to open so that clearance sales can commence”
— Henry Louis, the Editor-in-Chief of Insolvency Insider
Closing since COVID.PNG

What’s Next for Retailers

What has been an unprecedented few months are likely to continue through the summer and into the Christmas season for many Canadian retailers. The next chapter for Canadian retail looks to have red ink, lots of work for insolvency professionals and changes like we have not witnessed. The sector has weathered many a storm over the past few decades and ultimately it will survive this one as well. While these times will pose many challenges, they will also present enormous opportunities.

What Can a Retailer do to Survive and Thrive?

1.      Get Online

Online platforms have been important for many years, but they are no longer ancillary. All retailers need an efficient online platform that is consistent with their brand and physical shopping experience to remain engaged with customers. If your online experience is second rated, customers are likely to try elsewhere. Hence, the recent stock market success of Shopify. Its e-commerce platform and channels are critical to retail success today and is no longer a secondary sales strategy. 

2.      Make Changes to Improve Efficiency

Retail business have limited resources, now more than ever. They need to have good people, excellent systems and a measurement and review process in place that provide instant reviews and feedback to the management of the business. Are sales associates dealing directly with customers (online and in the store)? Are customers visiting your site buying product? How does the inventory look – what is selling for a profit? Any “boat anchors”?  Sometimes the answers to these questions are not always easy but now is the time to embrace change and implement innovative systems and management tools to optimize the business. 

3.      Consolidation

The sector is dominated by a handful of conglomerates. Many of these groups hold grocery and “essential retail” at their core. While portions of their business are undoubtedly hurting, it would appear their core businesses are thriving. When certain sectors of an industry thrive while others stagnate or decline – the door for M&A opens wide. See this bubble chart prepared by the Canadian Retail Counsel outlining the major players in the Canadian retail space by gross revenue. 

Bubbles.jpg
Sourced from Canadian Retail Counsel

Sourced from Canadian Retail Counsel


Almost all of the top 20 entrants in the chart above have been very acquisitive in their corporate history. It is near certain the current period of change will be followed by significant M&A activity. The large players in the sector have cash and strong businesses. They will seek to bolster their market share and add businesses they see as good value with positive long-term prospects.

May7.PNG

In The End - Are You a Buyer or Seller?

Times of uncertainty and reduced profits are rarely the right time to sell your business. However, sometimes the best time to sell is when the owners are ready. If you are not embracing the current challenges, let’s have a call. We can give you an unbiased opinion on your prospects in the market. 

On the other hand, perhaps you see opportunity at every turn and do not have the capital or the resources to act on them all. Let’s have a call. We can support you to ensure the next big opportunity is not missed. 

We wish you and your business the best during this remarkable transition period. We are here to help now or whenever you need support with a transaction or just managing through some financing, projections, banking or other challenges.

Contact Us

Oil Price Support in North America Potentially on the Horizon

(but outlook still not great for Oilfield Services)

As North America looks to reopen over the coming weeks, we expect a modest recovery in oil demand. While there will be hiccups along the way during the gradual reopening, an improvement in demand for oil is critical especially for oil producing provinces like Alberta and Saskatchewan. The global energy industry like many, is experiencing a demand shock. This shock will be offset by two concurrent moves: a decrease in supply and a rebound (of some sort) in demand. This article investigates US oil production that has contributed to the surge in supply in recent years, and the recent reduction in production in five key regions.

The supply side, and major driver of the unfortunate oil price war, has been driven by US production increases. The increases are predominantly from a handful of basins: Anadarko, Bakken, Eagle Ford, Niobrara and the Permian. June production numbers are from the May 18th, 2020 EIA Drilling Productivity Report.

*peak production for all five regions combined.

*peak production for all five regions combined.

Collectively, these five basins accounted for over 7.4 million bbl/d of production increases over the last decade to the November 2019 peak. Astonishing and a clear indicator of why the Saudis felt a price war was necessary – albeit terrible timing for everyone.

The key driver behind the surge in production is the significant technological improvements, resulting in substantial gains in US production output per rig. Through technology, these regions have seen significant increases in the average new well production per rig[1].

Average Production.png
 
Capture.PNG

With increased growth in production, we are also seeing significant legacy well production declines month over month. Translation: In order to maintain production levels, many new wells need to come online each month.

Legacy Production Decline Rates.png
 
Capture.PNG

For aggregate production to hold or grow, continued improvements in technology to increase existing production are necessary, as well as continued new drilling activity. Over time we are seeing the volumes of legacy production declines increasing, including a large downward ‘blip’ in May 2020. We believe the declining storage capacity and the shut-in of some legacy wells due to the current low price environment contributed to this result, but the long-term trend remains the same: more production is coming offstream from legacy wells, meaning it needs to be replaced to maintain overall production levels.Overall production has been in decline in these basins since late 2019, with June production expected to see an overall decline by over 1.3 million bbl/d. 

Decrease in Production From Late 2019 Regional Peak Level

Sourced from U.S. Energy Information Administration

Sourced from U.S. Energy Information Administration

With drilling activity and overall production declining in all these regions even before COVID-19 and the global oil price war, a downward trend in US production was already underway. Since the November 2019 peak of output across these five major regions, we’ve seen a 1.24 million bbl/d decrease in production. According to the EIA’s May 2020 month-over-month drilling productivity report, the most recent monthly decline was 196,000 bbl/d, led by an 87,000 bbl/d decline in the Permian.

Near-Term Outlook: Lower production, soft OFS activity & stronger WTI Prices

Based on new oil production per rig and legacy production declines, the number of rigs necessary to maintain current production levels is much higher than the current rig counts in each region. We expect to see continued large production declines over the upcoming months, especially in the Permian and Eagle Ford basins. The table below (which represents a worst case scenario) outlines a large bbl/d production decline projection on a monthly basis. Net production is unlikely to reverse until drilling activity begins to rebound, which we don’t expect until 2021 at the earliest.

 Potential Net Production Decline Rates at Current Activity Levels

Rig Count Basin.PNG

WTI prices should see strength and a bounce back (which is already underway as WTI climbs above $30 per barrel). The next few months should see an additional 1-1.5 million barrels/day of additional net declines in US production from these basins as producers scale back spending, conserve cash, and preserve balance sheets. Additionally, we expect to see additional producer insolvencies, which will further reduce activity in the near-term.

Producer cash flows and balance sheets are under pressure, leading to:

Capital spending plans

Debt levels

Availability of credit / capital

Cost to available credit / capital

The Result: E&P’s will maintain spending constraints until cash flow situations improve.

Even in the event we see a significant jump in prices, there remains excess crude held in on and off-shore storage. With over 7,600 drilled-but-uncompleted (DUC) wells and additional wells shut-in, the need for substantial increases in drilling activity will remain low. Overall, our outlook for drilling companies even in a price growth environment (which we expect), is weak for at least the next 12-18 months.

Well service companies may fair marginally better as shut-in wells, and DUC wells come online as these represent a cheaper alternative to adding new production.

As we see production declines in these US basins, we expect to see stability and growth in WTI prices over the next couple of quarters. This may lead to increased capital budgets in 2021, but we believe balance sheets, cash flow and access to capital will remain challenges for many producers into next year.

[1] Monthly additions from one average rig represent EIA’s estimate of an average rig’s contribution to production of oil and natural gas from new wells.

Catastrophic Global Energy Disruption

Introduction:

Mark down April 20, 2020 in the energy history books: the first time ever both Western Canadian Select (WCS) and West Texas Intermediate (WTI) traded at negative prices. Yes, you read that right. Traders were being paid to take oil.

The economic impact of COVID-19 has significantly disrupted global economies, particularly the oil and gas industry. Gas stations are in no rush to re-stock inventory with citizens under lockdown. Factories remain shut down or are running at limited capacity. According to BBC, the number of passenger planes have been reduced by 95 per cent. Major US refiners including Marathon Petroleum, Valero Energy and Phillips 66 have lowered and shut down facilities with a lack of fuel buyers. In other words, demand has decreased significantly. Global crude production has been increasing over the past decades to meet growing demand. However, the sudden decrease in demand today has led to an oil market imbalance situation no one expected just a few months back.

This article investigates the fundamentals behind negative oil prices: supply and demand, and as a result, the oil storage shortage.

60 Second Recap:

We highlight some key events impacting global energy markets within the past two months in the timeline below:

WTI Future Contracts

Sourced from FactSet, CNBC Data

Sourced from FactSet, CNBC Data


Why are Prices Negative?

“When producing oil, you have two options – you either use it or you store it”.
— US Secretary of Energy Dan Broiullette.

This brings us back to ECON 101: supply and demand. In the case of oil, production and consumption.

consumption.PNG

The chart illustrates how production is outpacing consumption levels in Canada over the past decade or so, prior to COVID-19. The impact of the pandemic has further depressed consumption levels. Note that oil imports are not factored in the chart above.

A.      Supply / Production

Despite the lack of oil demand, oil producing nations continue to produce, albeit at slightly lower volumes. This has resulted in crude inventories worldwide filling up at an alarming rate. According to the IEA on April 7, global production was 101 million bbl/d in 2019. The production cuts agreed upon in mid-April by OPEC+ and G20 nations will see a 10 million bbl/d reduction from May 1 onwards. Of the cuts, the US, Canada and Brazil are expected to reduce production by 3.7 million bbl/d proportionately.

In Canada, the 2019 average crude production was 4.2 million bbl/d (Statistics Canada). Based on 2019 oil production proportions, Canada is estimated to reduce production by 0.8 million barrels from May onwards, a 16 per cent decline compared to 2019’s average production levels.

We now look at the current situation from the perspective of demand.

B.      Demand / Consumption

As most of the world’s population is currently in lockdown, global oil demand has cratered to rock bottom levels. According to the International Energy Agency (IEA), the world consumed an average of 100 million bbl/d in 2019. Of this, Canada consumed 2.5 million bbl/d. Currently, the IEA predicts consumption to have declined by 29 per cent. This is supported by other industry estimates of a 30 per cent decline as per commodity traders Trafigura and Vitol.

By using a 30 per cent reduction assumption in oil consumption today for both Canada and the world, we compare this to oil consumption levels between 1980 and 2018 below:

Data sourced from: BP Statistical Review of World Energy

Data sourced from: BP Statistical Review of World Energy

Based on this analysis, the current global consumption estimate of 70 million bbl/d is similar to the consumption levels 18 years ago in 2002. This was back when Jean Chrétien was Prime Minister, the world was introduced to its first ever cell phone with a built-in camera and Elon Musk had yet to acquire Tesla Motors.

In Canada, the estimated current oil consumption estimate of 1.76 million bbl/d is similar to consumption levels 33 years ago back in 1987. This was back when the Loonie was first introduced, the Canada-US Free Trade Agreement (predecessor to NAFTA) was signed, the first Canadian Starbucks was opened in Vancouver and the Simpsons cartoon first appeared.

A 30 million bbl/d decrease in global consumption is significant. However, the 10 million bbl/d production cut agreed by OPEC+ and G20 nations in mid-April represents only one-third of the consumption decline. We now look at how both oil supply and demand have affected oil inventory storage.

“If your bathtub is about to overflow and you turn down
the tap a little, it will still overflow.”
— SEB Research

C. Global Storage

Both supply and demand have resulted in oil inventories surging in recent weeks. The EIA’s April 7 forecast estimates global inventories to increase from 5.7 million bbl/d in Q1 to 11.4 million bbl/d in Q2. Inventory levels are projected to be at its highest levels in Q2 before decreasing in the second half of 2020 with the gradual return of economic activity.

We investigate the number of days before global storage is filled up below:  

global storage.PNG

Based on our analysis, it would take 50 days or until the end of May 2020 for global oil storage to be maxed out under the current conditions.

“1.3 billion barrels will be added to global markets in Q2, exceeding the 1 billion barrel storage capacity available currently by May 2020”.
— OPEC, April 9.


Canadian Crude Storage

According to Oil Sands Magazine (OSM) as of April 14, Canada’s total storage capacity is 96 million barrels with another 7.2 million barrels of storage capacity under construction.

Most Canadian crude storage facilities are located in Alberta, especially in Edmonton and Hardisty. Various predictions on Canadian storage levels are highlighted below:

Source: Oil Sands Magazine, April 17, 2020

Source: Oil Sands Magazine, April 17, 2020

  • Rystad Energy predicted in mid-March that Canadian storage availability would run out by the end of March. The pressure was somewhat eased with producers cutting back on production.

  • In mid-March, HIS Markit estimated total oil storage in Alberta at between 80 and 85 million barrels, of which 65 - 75 million barrels were currently in storage.

  • Goldman Sachs predicted on April 1 that commercial inventory levels could be breached within 2-3 weeks if Canadian production is not reduced further.

If the situation persists, producers may face no option but to shut down production. This represents unchartered territory for Canadian producers, where shut down considerations are motivated by both storage limitations the pricing environment However, shutting down Canadian oilsands production incurs the risk of causing permanent damage to the reservoirs, jeopardizing billions of dollars of assets.

South of the Border

The bulk of Canadian crude is exported south to US refineries. However, the EIA reports that US refinery utilization rates are currently at 68 per cent of total capacity, the lowest since 2008 and just slightly above all-time lows. US storage is filling up fast as well. The EIA also reported on April 17 that total US crude storage capacity was 653 million barrels, with 79 per cent capacity currently utilized.

We investigate the number of weeks before US inventory will be maxed out:

US.PNG

Note:

1. EIA estimates 11.5 million bbls per week in excess supply from April 17 onwards.

Based on this analysis, US storage will be maxed out at the beginning of June, at the latest. Our estimate is supported by the following predictions for comparison:

  • Goldman Sachs reported on April 17 that Cushing storage will be “stock out” by the first week of May.

  • IHS Markit’s Oil Price Information Service estimated on April 21 that Cushing storage will be “stock out in two or three weeks” (mid-May).

  • New York based investment bank Mizuho Securities USA predicted on April 21 that US storage would “fill in 7 to 8 weeks” (mid-June) based on the current increase rate.

“Never before has the oil industry come this close to testing its
logistics capacity to the limit.”
— IEA
Boat.jpg

When land storage is maximized, the next consideration is storage on sea. Parties considering tanker storage allow tankers to float aimlessly pending a buyer or higher prices. Reuters reported that global oil tankers are hitting maximum capacity as well, with tankage storage rates increasing substantially since January 2020.

Did you know?

The going daily rate for the largest oil tankers in the world hit
US $180,000 on April 20.
— Reuters.

Conclusion:

The continuous flood of crude into global markets has created an oil storage crisis the world has never experienced before. The world is staring at 20 million bbl/d of excess product and nowhere to store this by the end of May or the beginning of June. Something must give way and that is the price of oil. Do not be surprised if the price of future contracts becomes negative again in the upcoming months. Tough times ahead.

The Canadian Food Manufacturing Industry during COVID-19

Introduction:

The impact of COVID-19 on the Canadian food manufacturing industry has been like no other. Canadian’s are buying more food, restaurants are closing or limiting services, boarder restrictions are in place and the food manufacturing industry is working on adapting its production processes to handle the challenges.

The horticulture industry may be without 50,000 workers, the dairy industry is having to dump excess milk, the seafood industry is stocked with product and nobody to sell it to, the meat industry is so far resilient to the challenges and some manufacturers are reducing the number of products they produce.

This article looks into the impact of the pandemic is having on the food manufacturing industry in Canada.

Factors That Have Impacted the Industry:

Canadians are buying more at grocery stores:

maxresdefault.jpg

COVID-19 fears resulted in many Canadians heading out to grocery stores to stock-up on essentials. When asked, most people suggest their primary concern was potential supply chain disruptions leading to product shortages, especially for food items. Most Canadians are buying more groceries because they are preparing more meals at home. The Food and Consumer Products of Canada (FCPC) reported that food manufacturers saw an increase of 500 per cent on food order volumes from grocery stores during the last two weeks of March alone.

Closed-Sign.jpeg

Restaurants are closing or reducing services:

With the increased recommendation of social distancing in Canada and with provinces and cities declaring state of emergencies, many restaurants have either temporarily closed or reduced services to just take-out and delivery. In 2017, the Canadian restaurant industry was worth more than $85 billion with over 81,000 full-service restaurants and limited-service eating places nationwide. The impact of COVID-19 has led to over 800,000 job losses in the restaurant industry. According to Restaurants Canada, 78 per cent of restaurants reported a lower sales volume in the first two week of March and 92 per cent are worried about sales over the next three months. With many of these restaurants temporally closed or reducing services, it has impacted the food manufacturing industry with reduced demand and the cancellation of bulk orders from suppliers.

Border Restrictions:

The Canadian government closed its borders on March 18, 2020. All foreign nationals have been banned from entering Canada, with the essential travel from the US being the only exception due to trade ties. Closed borders have greatly impacted the food industry with exports and migrant workers prevented from entering Canada.

Many countries have closed ports, imposed travel restrictions and shut down factories, negatively disrupting global trade and international supply chains. The EDC Economics team forecasted in spring 2020 the global growth at a meagre 1.6 per cent for 2020, the lowest it has been since 2008. The EDC Economics team also forecasted that Canada’s economy will only grow 0.4 per cent in 2020 due to the impact of COVID-19 and lower oil prices.

A Look at Specific Sectors:

Horticulture:

can1.jpg

The horticulture industry has been impacted by the border restrictions, which is estimated to keep nearly 50,000 migrant workers from entering. Without a solution, famers will be short most of their workforce to plant and harvest their crops. According to the Canadian Horticultural Council, the Canadian horticulture industry produced more than eight million metric tons of produce last year and exported over $5 billion worth. Without migrant workers, the horticulture industry in Canada will be dramatically impacted.

“It’s a huge impact for our growers — not just Ontario, but nationwide. There is no way that we would be able to farm without our migrant workers. I can’t put it any clearer than that,” said Steve Bamford, president of the Toronto Wholesale Produce Association “We will run into a big food security issue if that happens.”
— Steve Bamford, president of the Toronto Wholesale Produce Association

The government announced on March 23, 2020 that migrant workers are considered essential and would be allowed to enter Canada, on the condition that they self-isolate for 14 days upon arrival. Despite this, many farmers are still worried they will arrive late and that crops will not be harvested on time. Even though the migrant workers are allowed into Canada, there are many hoops to jump through, including getting to Canada which has been further complicated with airlines decreasing flights. Many farmers have indicated they would like to hire Canadians to support domestic employment; however, Canadians often do not want these seasonal jobs or do not have the required skill set, leaving farmers with no option but to turn to migrant workers.

Dairy:

In early April many dairy producers were forced to dump excess milk (up to 10,000 litres per producer) down the drain due to the lack of demand from the hospitality industry. Even though dairy famers have seen an increase in the retail side, it has not been enough to offset the decrease in demand from restaurants and other food services who have reduced or cancelled bulk orders.

Dairy bubble.png

Seafood:

The seafood industry in Canada has also been impacted mostly due to the lack of demand from the hospitality industry. Owner of West Coast Wild Scallops, Melissa Collier explains how they do their scallop fishing in the winter and stock up to have a steady supply for restaurants in the summer months. 

“We stocked up on what we thought we would sell in a normal year and we paid deckhand wages, we have done all of our boat and fuel expenses, and now we have a bunch of product sitting in cold storage that we are paying monthly fees on that we may never be able to sell.”
— Melissa Collier, owner of West Coast Wild Scallops

Another impact of COVID-19 on the seafood industry is the closure of the fishing licensing offices, which has resulted in significant delays in receipt of permits and thus, lower fishing activity levels. The government is helping the seafood industry with access to the $5 billion Farm Credit Canada loan program. The Farm Credit Canada program offers a 24-month credit line up to $500,000 at a rate of Prime +1% and no fees and is intended to help producers, agribusinesses and food processors to have access to the cash flow they need to manage through this challenging time. 

d4252386-76af-4117-9b8f-7d0d0c79f4ea-GettyImages-923692030.jpg

Meat:

The beef and cattle industry have barely seen a reduced demand due to COVID-19. Though it has not seen a decrease in demand, it has been impacted by employees testing positive for COVID-19 leading to meat plants shutting down.

“The Canadian beef industry is facing a period of extraordinary uncertainty,”
— Bob Lowe, president of the Canadian Cattlemen’s Association

One of Canada’s largest meat plants, Cargill in High River, Alta., which represent around one-third of Canada’s total processing capability has drastically reduced production due to multiple employees testing positive for COVID-19. Cargill is not the only plant that has had to reduce production, many plants have also started to temporarily close. With plants reducing production or closing, the supply of meat will drastically be impacted.

 
Foods+in+demand.jpg
 

Examples of Production Changes:

The FCPC reported that 80 per cent of manufacturing have increased production due to the pandemic. In the efforts to meet current demand, major food manufacturers in Canada have started to only produce core offerings to boost production efficiency and get food to Canadians faster. Some of these companies and their current production focus are listed below:

  • AB Mauri Fleischmann's – running the yeast plant at 25 per cent over capacity to meet the demand for yeast.

  • Italpasta – normally produces 63 types of pasta, during the pandemic the are only producing their top six types of pasta (spaghetti, spaghettini, penne, elbows, fusilli and lasagne).

  • Nestle Canada – announced it is reducing the number of product offerings for the time being and is closing managing supply chain.

  • Prairie Flour Mills – normally produces 35 different products, during the pandemic they are just producing basic flour.

  • Walmart Canada - mentioned that it is working closely with suppliers to cope with changes in demand during the pandemic.

 
Picture1.jpg
 

As noted in the above chart, 75 per cent of food manufacturers in Canada project they will be able to keep supplying their products for 2-5+ months. 20 per cent project they will have no issues and five per cent project that they will run into problems with their supply within one month.

Conclusion:

Despite the food manufacturing industry facing new and different challenges due to the impact of COVID-19, many producers have assured Canadians that they will continue to work hard and get food to Canadians. Canadian food manufacturers are putting forward their best efforts in maintaining production while emphasizing sanitation and physical distancing guidelines to protect both employees and customers.

We are all grateful for these unsung heroes who are making sure we have groceries on the shelves and food on the table every day. We also applaud the efforts implemented by Canadian food producers in combating the virus, such as switching their production lines to produce hand sanitizers and other medical equipment to help Canada fight COVID-19.

Canada Emergency Wage Subsidy Update

Prepared as of April 1, 2020

What?

  • 75% wage subsidy for qualifying businesses up to three months, retroactive to March 15, 2020.

  • 75% of the first $58,700 normally earned salary per employee, up to a maximum of $847 per week.

Who?

  • All employers (including proprietors and partnerships), except public sector entities.

  • If your gross revenue is derived from business activity in Canada and you pay remuneration to employees in Canada, you may qualify.

  • Additional details to come for non-profit organizations and charities.

Criteria?

  • At least 30% decline in gross revenue in March, April or May, as compared to the same month in 2019.

  • Flexibility applies for businesses not active in the prior year’s comparable month.

When?

  • Estimating between three and six weeks; six weeks being the worst case scenario.

How?

  • TBD, aiming for direct deposits to employers.

What if your business does not qualify?

  • May still qualify for 10% remuneration paid from March 18 to June 20.

  • Up to $1,375 per employee and $25,000 per employer.

Example: Tom, employee at ABC Inc.

Note: Wage subsidy is 75% of pre-crisis / normal wages.

Note: Wage subsidy is 75% of pre-crisis / normal wages.


Employer To-Dos:

  1. Pay employee $750 / week.

  2. Visit CRA system to:

    • Attest $750 in wages paid.

    • Attest to the 30% or more revenue drop.

  3. Keep all documentation and records.

Reality Check

There are several concerns and unanswered questions that may hinder the program’s objective of reducing layoffs. We’ve summarized the key concerns below:

A. Criteria

  • Businesses with tight margins may be suffering significantly without meeting the 30% gross revenue decline.

  • Unfair to new businesses and seasonal businesses impacted to meet criteria.

  • Unfair for businesses that experienced a one-off major impact to operations last year to meet criteria.

B. Timing: 3 - 6 weeks out

  • Expects small businesses to float over three payroll periods before receiving funds.

  • Small business loans are unlikely to be funded before six weeks, unless businesses already have existing banking instruments in place.

  • The $40,000 small business loan may help but would be additional debt burden on businesses already fighting for survival.

  • $40,000 small business loan most likely requires established or established relationship between bank and company.

  • Small businesses with negative cash flows are unlikely to bring back staff that have already been laid off.

Technicalities

  • Based upon pre-crisis level of earnings.

  • Comparable month in previous year as basic guideline. Flexibility only applies for businesses not active in the prior year’s comparable month. May allow companies to use other comparisons then.

  • No double dipping: if firm has claimed 10%, that amount will be subtracted from the 75% subsidy application.

  • For professional corporations and non arms length corporations, employees need to be on payroll before March 15.

  • $40,000 small business loans to be provided by banks or financial institutions, not by CRA. Businesses to apply for loan on financial institution websites and meet certain bank criteria to qualify.

  • With wage subsidy, employees are not entitled to EI or CERB funding.

Conclusion

The current wage subsidy program appears to be more suited to medium to large businesses with the resources to fund salaries within the 6-week time frame before funding becomes available. This includes access to existing operating lines to float near term cash requirements. The program is less effective for small businesses already facing a near-term cash flow crunch.

For more information visit: https://www.canada.ca/en/department-finance/news/2020/04/the-canada-emergency-wage-subsidy.html

Protein Industries in Canada

Canada is a world leader in the production of plant-based proteins. According to Agri-food Innovation Council’s March 2019 report, Canada recorded over $1.5 billion in in plant-based protein sales in 2016/17. Canada’s current production is predominantly beans, chickpeas, lentils and peas. Research and Markets estimates the global market for plant protein to reach USD$14.32 billion by 2023, a compound annual growth rate of approximately 8.1 per cent per year. 

Photos sourced from Agri-food Innovation Council

Photos sourced from Agri-food Innovation Council

Protein Industries Canada (PIC) was established in 2018 as an industry-led, not-for-profit organization to position Canada as a leading global source of sustainable, high-quality plant protein and plant-based co-products. PIC is tasked with investing over $150 million as part of the federal government of Canada’s Innovation Supercluster initiative. The intention is for PIC to advance economic growth through innovation in plant-based proteins and co-products for global export. According to the Agri-food Innovation Council, the industry-led consortium is expected to help generate an estimated $853 million in new commercial activity, add $15 billion to Canada’s GDP and create up to 50,000 new jobs. To date, the group has made investments up to $33 million, which has contributed to $67 million being invested in the sector.

Current Investments:

Current+Investments.jpg

PIC is actively working with industry partners to create co-investment projects that have the potential to transform the agriculture and food production sector.  Future investments will be focused within the following main areas: 

Graphics.jpg
grow.png
Sell.jpg

Create - improvements to protein content, quality and functionality with an aim to improve processing efficiency and the development of novel food ingredients.


Grow – efforts on primary production and sustainability using technologies related to data and predictive analytics, artificial intelligence, automation and sensor technology to increase production efficiency.


Make – improve processing through enhancement of new technological development.


Sell – focus on development of new markets, could involve pre-competitive research, prototyping and testing, improved trade relationships and trade literacy.


If you have an innovative product / technology within this space and are seeking funding, refer to:

a.  PIC’s program: https://www.proteinindustriescanada.ca/program

b.  PIC’s project eligibility questionnaire: https://www.proteinindustriescanada.ca/uploads/program/PIC_Eligibility_Form.pdf

If you need assistance with the application process or would like an introduction, don’t hesitate to reach out to us at Whitehorn. We’re here to assist you.

Artificial Intelligence of Things

Artificial Intelligence of Things (AIoT)

AIoT is a combination of both the Internet of Things (IoT) and Artificial Intelligence (AI) to create a more enhanced and efficient IoT. AIoT significantly improves human-to-machine interactions and boosts data management and analytics.

The Internet of Things

IoT in its most basic form takes objects and connects them to the internet, allowing the objects to receive and send information. The objects are unable to automatically act on the information it receives but device operators and field engineers can act on the data collected. The information collected from the objects are stored on a cloud or a super storage that the object can connect to.

 
DYK+1.jpg
 
IoT – Objects receiving/ sending data to the cloud/ super storage.

IoT – Objects receiving/ sending data to the cloud/ super storage.

Artificial Intelligence

AI allows machines or computer algorithms to think, learn and act like humans. AI learns from patterns or features in large amounts of data. AI can provide human-like interactions with software and make decisions for specific tasks.  

Artificial Intelligence of Things

AIoT – Objects sending/ receiving data and communication with one another without having to be sent to the storage system first.

AIoT – Objects sending/ receiving data and communication with one another without having to be sent to the storage system first.

As previously mentioned, IoT allows objects to receive and send information. However, the object is unable to act on the information it collects. This is where AI comes into play. AI gives IoT a “brain”, allowing the objects to have machine learning capabilities and improved decision making without human help. IoT provides the data for AI to analyze and act upon.

AIoT can process, produce and act on insights from vast amounts of data far quicker than any human can, allowing AIoT to make decisions instantaneously. AIoT also allows for systems to be proactive rather than reactive. AIoT is able to proactively detect failures and events before they happen, saving both money and time. From a business perspective, AIoT can help deliver on KPIs by automated monitoring and discovering the root cause of a problem and fixing it immediately.

 
DYK 2.png
 
amazon go.jpg

Our Future with AIoT

Cashier-less grocery stores:

Amazon.com’s Amazon Go Grocery allows customers to shop without going through a check out. Instead, after the customer leaves, they receive a receipt on their Amazon Go app of what they bought. Amazon Go stores are full of cameras, tracking devices and technologies that have deep learning abilities, allowing Amazon to know what someone is putting into their cart. Amazon started with smaller convenience stores and opened its first full-size grocery store in Seattle in late February of 2020.

The future of AIoT could lead to all major grocery stores such as Sobey’s and Co-op changing to cashier-less systems. A cashier-less system reduces the amount of manpower needed to run the store, therefore reducing the overhead for companies.

Spending less time in traffic:

grit-daily-self-driving-florida.jpg

With AIoT, self-driving vehicles have the ability to communicate with traffic indicators such as light poles, other self-driving vehicles and more. This allows cars to have up-to-date information about traffic conditions ahead and have the vehicle take an alternate route.

 
DYK+1+-+Copy.jpg
 

AIoT in Warehouse Operations

AIoT benefits many industries, including warehousing operations. AIoT has the capability to change warehousing from forecast-driven to demand-driven instead. Most warehouses are already set up with IoT in their conveyors, automatic guided vehicles, automated storage systems, handheld devices, scanners, voice systems and more. Adding AI to the mix will allow for data to be analyzed and acted on.

The more data about actions and interactions that AI receive, the more it can learn about how to adapt to current conditions
— Sean Elliott, Chief Technology Officer from HighJump, a Minnesota based software company.

How AIoT will Transform Warehouse Operations:

  • Communication – AIoT will allow for all elements of the automatic system to talk to each other and learn from each other, enabling them to implement real-time adjustments and improvements.

  • Logistics – AIoT will help reduce operator error and processing times while increasing efficiency and productivity by using machine-learning algorithms to enable detailed stock movement forecasting and management.

  • Productivity – AIoT will improve productivity in pick-and-pack processes with machine-learning algorithms.

  • Inventory – AIoT will help reduce the amount of money spent on inventory control with a more precise and accurate inventory control system that uses radio frequency identification (RFID).   

AdobeStock_207935723.jpg

AIoT in Fleet Management

Another industry that will benefit from AIoT is fleet management. AIoT can help monitor fleets, reduce fuel costs, track vehicle maintenance, identify unsafe driving behaviours and more. Using IoT in fleet management is increasingly common, but including AI along with IoT can be even more beneficial. AIoT can provide real-time solutions to optimize the entire fleet management ecosystem.

Benefits of AIoT in Fleet Management:

  • Supply chain planning: Optimize supply chain operations with real-time visibility into fleet/cargo location and traffic data, enabling improved delivery estimates and mitigation of service disruptions.

  • Equipment reliability: Leveraging real-time operating data to drive improved maintenance planning and execution (predictive maintenance) to increase up time and utilization of assets.

  • Safety: Combine equipment operating data, location data, environmental factors and characteristics of freight to assess real-time safety concerns, such as speed violations, derailment risk, cargo stability, hazardous material spillage and more.

  • Fuel management: Reduce fuel consumption (largest operating expense) through adaptive operations based on environmental and network status. Optimize fuel planning across delivery routes based on real-time pricing and refueling times.

  • Driver compliance: Monitoring driver behavior to ensure compliance to regulatory or business operating procedures to minimize excess wear on critical business assets.

  • Track/road inspection: Lower maintenance budgets through improved track or roadway inspection procedures that use deep learning vision systems, correlated to location and operating data, to provide automatic detection of degraded infrastructure.

- Sourced from SAS: Analytics, Business Intelligence and Data Management.

Currently, most fleet management is done by using GPS to locate the vehicles, which can sometimes have a loss of signal when driving through areas with poor satellite coverage. With AIoT, there are other ways to track the vehicle, such as monitoring speed and turning rate allowing AI to calculate where the vehicle is at any given moment with GPS.

 
DYK 2 - Copy.png
 

Conclusion

Even though AIoT is still rather new, it is already starting to change our everyday lives, from cashier-less grocery stores to self-driving cars. AIoT will help many industries become more efficient, including warehouse management and fleet management. The possibilities as to what AIoT can help us with are endless and AIoT will end up revolutionizing our workplace and personal lives.

Energy Innovation: Tackling Climate Change

Introduction

In today’s age of climate change, the Canadian oil and gas industry has become vilified in mainstream media with many critics claiming oil and gas companies are solely motivated to maximize profits without a concern for the environment. Many claim that the sector continues to deny and shun the ongoing climate change crisis; the oil and gas sector acknowledges the issue at hand and industry players have been pursuing initiatives in technological development and innovation to tackle their impact on the environment. This article highlights the various initiatives by Canadian oil and gas companies to reduce their environmental footprint.

A Look at Energy Innovation in the Past 

Innovation in the Canadian oil and gas industry has been continuously evident over the course of history. When faced with challenges, the industry has time and time again successfully overcome challenges using technology and innovation.

Some examples include:

Throwback+Timeline+-+Copy.jpg

Tackling the climate change issue is no different. Industry players understand that technology and innovation play a pivotal role in overcoming this global issue.

Setting the Bar

Canadian oil and gas companies continue to set the bar high environmentally. Some of Canada’s largest oil and gas producers have committed to the following climate pledges:

Setting the Bar - Copy.png
Low+Carbon+Coke+Boiler.jpg

Oil Sands Innovation

Companies operating within Canada’s oil sands constantly focus on technological innovation to increase efficiency, reduce operating costs and optimize environmental performance. Some examples of oil sands innovation that tackle GHG emissions are highlighted below:

1. Carbon capturing & storage (CCS) and carbon capturing, utilization and storage (CCUS)

Instead of releasing CO2 into the atmosphere, CCS stores CO2 underground in deep, porous rock formations. Industrial CO2 produced is compressed into fluid form before being transported by pipeline to a site where it is injected underground for permanent storage. CCUS encompasses recycling industrial CO2 for utilization in other industrial applications, such as upstream production, cement production and fertilizer manufacturing.

Canada’s CCS and CCUS technology is world-leading, as demonstrated by several projects highlighted below:

AB_SK Map.png
Untitled-3.jpg
DYK+1.jpg
DYK%2B2.jpg
 
Untitled-4.png
 

2. Advanced oil sands recovery technologies

A large amount of steam is required to dilute bitumen for production. Oil sands recovery technological development intends to reduce the amount of steam required for in-situ bitumen recovery. Reducing steam consumption decreases the amount of natural gas burned to create steam, in turn reducing GHG emissions.

Steam reduction can be achieved in several ways including light hydrocarbon injection and heating bitumen underground using electromagnetic waves. Depending on the quantity of light hydrocarbon, the viscosity of bitumen can be substantially decreased to reduce the steam required. In addition, electromagnetic heating specifically targets parts of the reservoir instead of heating the entire reservoir, thus increasing heact efficiency and minimizing heat loss. The illustration below highlights the electromagnetic heating technology implemented at Suncor’s Dover oil sands project:

Enhanced Solvent Extraction Incorporating Electromagnetic Heating (ESEIEH)

 
ESEIEH.png

Other Recent Innovation Initiatives to Reduce GHG Emissions

 
Initiatives%2Bto%2Breduce%2BGHG.jpg
 
 
DYK 3.png
 

Conclusion

The war against climate change cannot be won overnight. Shutting down all oil and gas operations in favour of renewable energy today is currently unrealistic and unfeasible (see our Moving Away from Fossil Fuels article for more). Canadian oil and gas companies continue to demonstrate resilience in navigating through a low commodity price environment while tackling climate change. To comment that these companies are only focused on short term profits is misleading. Company executives within the industry believe that companies who fail to adapt to the low carbon future will face carbon related risks, while those that act today will position themselves for long term business resilience.

The future success of Canada’s oil and gas industry depends on its ability to develop and deploy new technology that can reduce environmental impacts while improving performance. Based on the initiatives highlight above, it looks like we are on the right track.

A Plus from the Recent Deep Freeze

The cold likely killed some pine beetles.

Long before the current federal Liberal party and British Columbia’s NDP party took turns lobbying obstacles on Alberta, Mountain Pine Beetles (MPB) began their economic and landscape changing onslaught. The MPB attack has been underway in Alberta since the early 2000s. These pests have expanded beyond their traditional habitat of Western North American pine forests to the boreal forests of Alberta, with Saskatchewan in their sights. BC knows the impacts of the beetle all to well, with over 50 per cent of BC’s pine tree volume killed by MPB and a long-term impact of $57 billion in lost GDP. In Alberta, the remaining pure pine trees are estimated to be worth over $11 billion.

The current land area of Western Canada that has been impacted is presented below:

Beetle map.png

Extreme cold is known to slow down the spread of the beetle. When temperatures drop below -30ºC for a few days or more, the chances of MPB larvae perishing increases significantly. As the figure below shows, northwestern Alberta experienced these low temperatures during the week of January 13, 2020.

Picture2.jpg

Mountain Pine Beetle Facts:

 
Beetles.png

During the week of January 13, 2020 temperatures were very low for an extended period of time causing a chance that it killed some MPB and their larvae. Janice Cooke, a University of Alberta biological sciences professor mentioned that the cold weather in Jasper last week might have killed more than 95 per cent of the MPB larvae in the area. Cooke noted that the total number of beetles/larvae that died during the cold snap would not be known until the ground surveys are completed later this summer. The more MPB larvae that die in Alberta, the slower MPB can attack the rest of Canada.